73. Working with VPlans
A VPlan is a machine-readable verification plan that facilitates analysis by organizing metrics and run data into a hierarchical framework.
See Creating VPlans for the different ways to create a VPlan.
73.1 Opening the VPlan Editor
To open the VPlan Editor, in your Workspace, click the Navigation menu  icon at the top of the window, and select VPlans.
You can perform the following tasks in the VPlan Editor:
- Create a VPlan
- Edit a VPlan
- Modify section attributes
- Manage VPlans
- Work with VPlan views
- Analyze metrics
- Link a VPlan to project requirements
73.2 VPlan Structure and Content
When you upload a test suite, Foretify Manager generates a default VPlan and a metrics model based on the metrics defined in the suite. Foretify Manager then maps the data collected during the runs to the VPlan.
You can use the default VPlan or create a custom VPlan to suit your needs. A custom VPlan might have top-level sections such as Scenarios, Driving areas, Regulatory criteria, Risk dimensions, or Autonomous functions, each with nested sub-sections.
The default VPlan and the metrics model include the following:
- Environment (time, day, weather)
- Scenarios
- Scenario parameters
-
top.info with:
- end events
- Main issues (errors and warnings)
- Models (end event, Foretify version, simulator version, and maps)
- Runs (map information)
-
Actor
drivemetrics
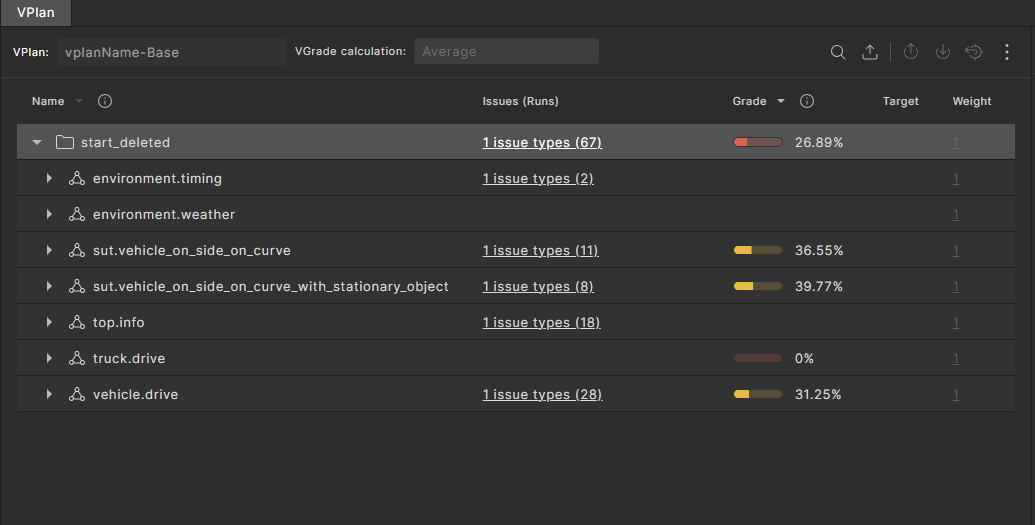
The top-level entities of the metrics model in a VPlan are marked with a vector  icon.
icon.
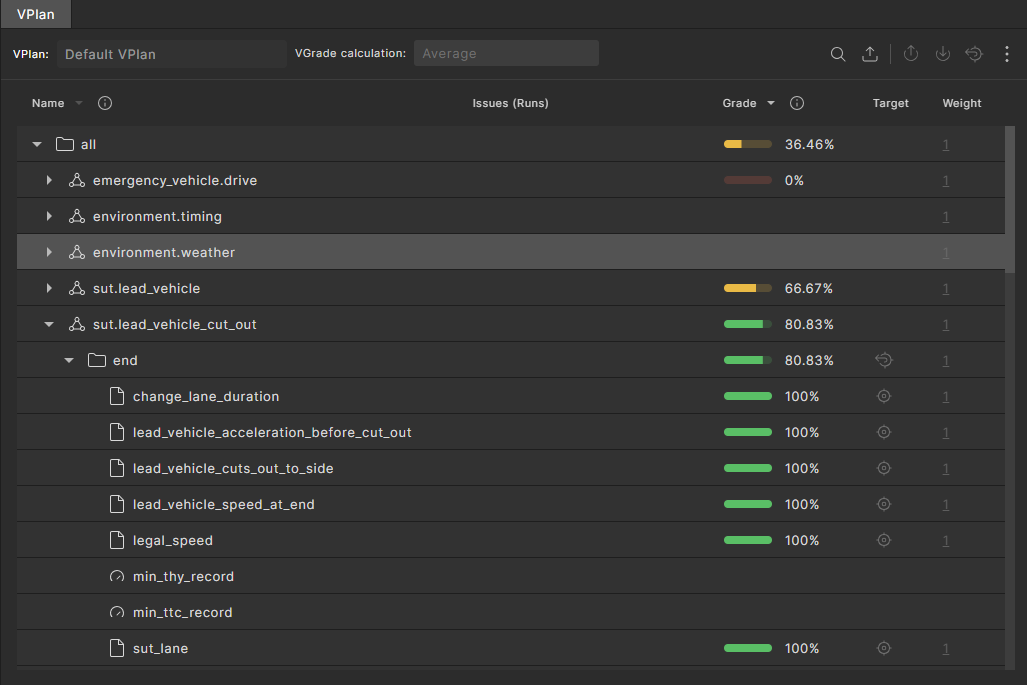
Each scenario contains:
- One or more events, including the predefined end event, marked with a folder icon
- Cover metric items, marked with a page icon
- Record metric items (KPIs), marked with a meter icon and located under their associated event
You can add entities to the VPlan that are not part of the metrics model. For example, there are no metric items associated with checkers. However, to make the VPlan complete, you can note where checkers are defined by creating a checker section and adding checkers to that section, such as those defined with collect(). See Add a new section.
73.3 Buckets
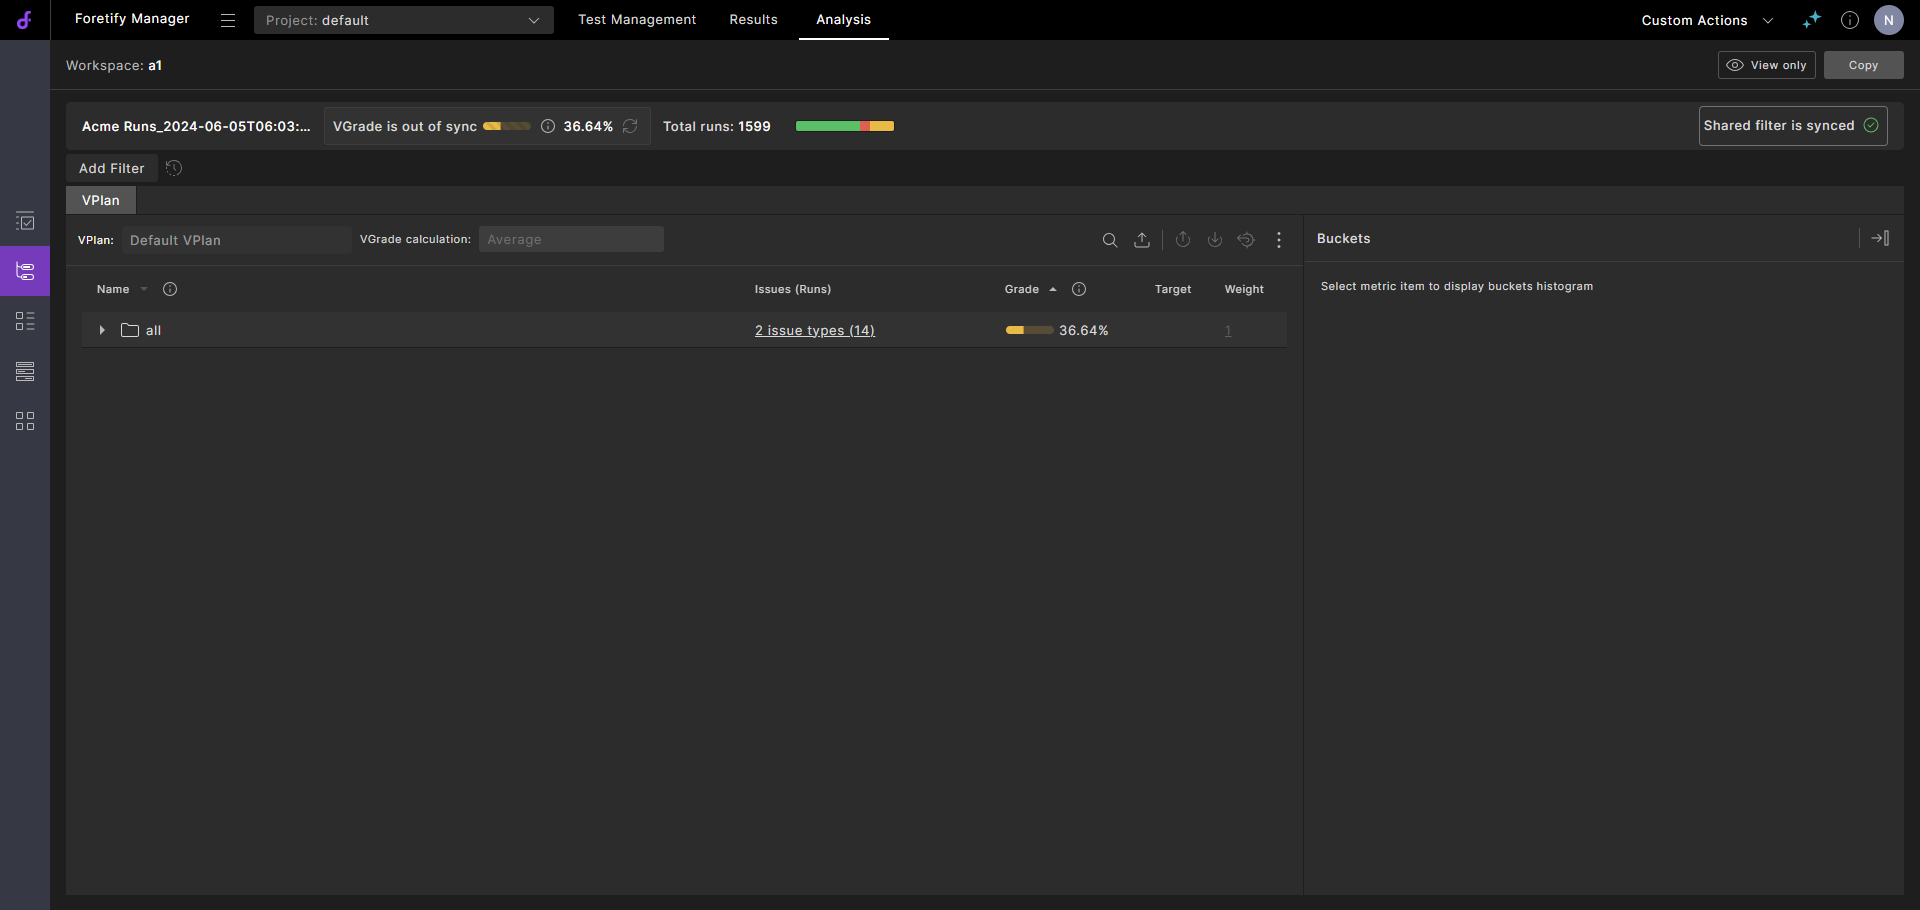
When you select a metric item in the VPlan tree, a list of possible values appears in the Buckets pane. If the range of values is large, they are grouped into ranges called buckets for easier viewing.
The first time you open a VPlan in the VPlan Editor, the Buckets pane is collapsed.
Note
After you manually collapse or expand the Buckets pane, your preference is saved and applies across all VPlans.
For information about the Buckets pane options, see Analyzing metrics.