70. Analyze runs
The Runs tab helps you identify the main issues in a test suite. As shown in Figure 1, the Runs tab displays a table on the left listing the runs in the selected test suites. From this table you can access the Debug Run window, which lets you review the selected run in the Visualizer.
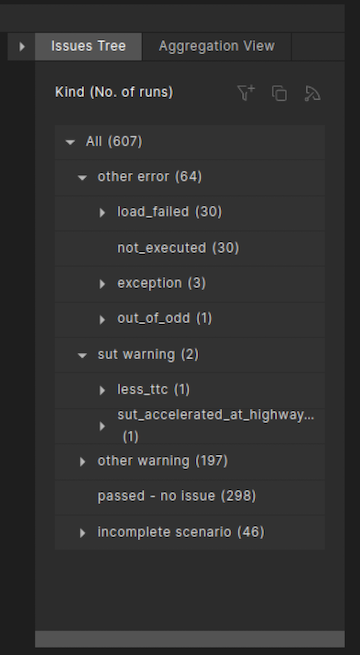
The Issues Tree to the right of the table displays a hierarchical list of issues that occurred during the selected test suite executions, ordered by category, such as SUT Error, Other Error and SUT Warning.
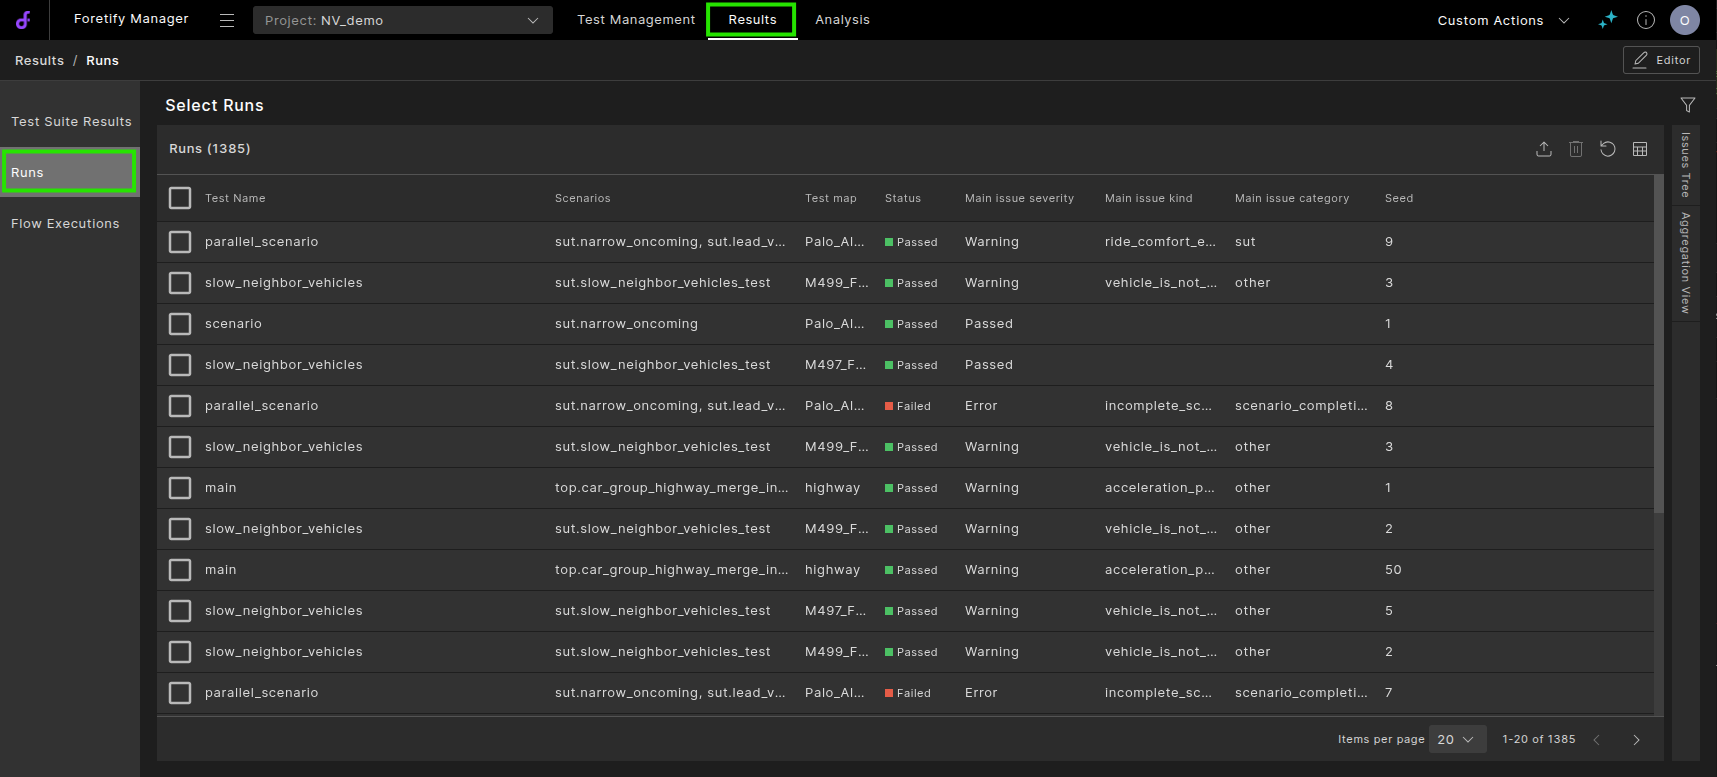
To open the Runs tab, do one of the following:
-
If your runs are not in your current project, click the Projects dropdown list and select a project.
-
From the project, click the Runs tab.
Note
You can also access runs by clicking the Test Suite Results tab, selecting one or more test suites and clicking Show Runs. The Runs tab displays with the runs from the selected test suite.
After opening the Runs tab, you can:
- Modify the runs or run attributes displayed in the Runs tab.
- Identify the main issues of a test suite using the Issues Tree.
- Debug a failing run.
- Compare a run with another run on the same map. Select a run, then click the Compare runs icon. See Compare runs on the same map.
Notes
-
The view of the Runs tab is the same regardless of whether you open it from the Test Suite Results tab or the workspace. However, some of the tasks listed above you can perform only when you open it from a workspace.
-
For more information on analyzing and resolving particular issues, defining custom issues, and so on, see Understanding and resolving issues.
70.1 Modify the Runs tab
You can modify the runs or run attributes displayed in the Runs tab by:
- Changing the rows or columns displayed in the table. See Table display.
- Creating or modifying run filters. See Create a run filter.
70.1.1 Run duration attributes
You can display various run attributes related to the duration of each run.
Click the Column Selection  icon to select attributes display in a table.
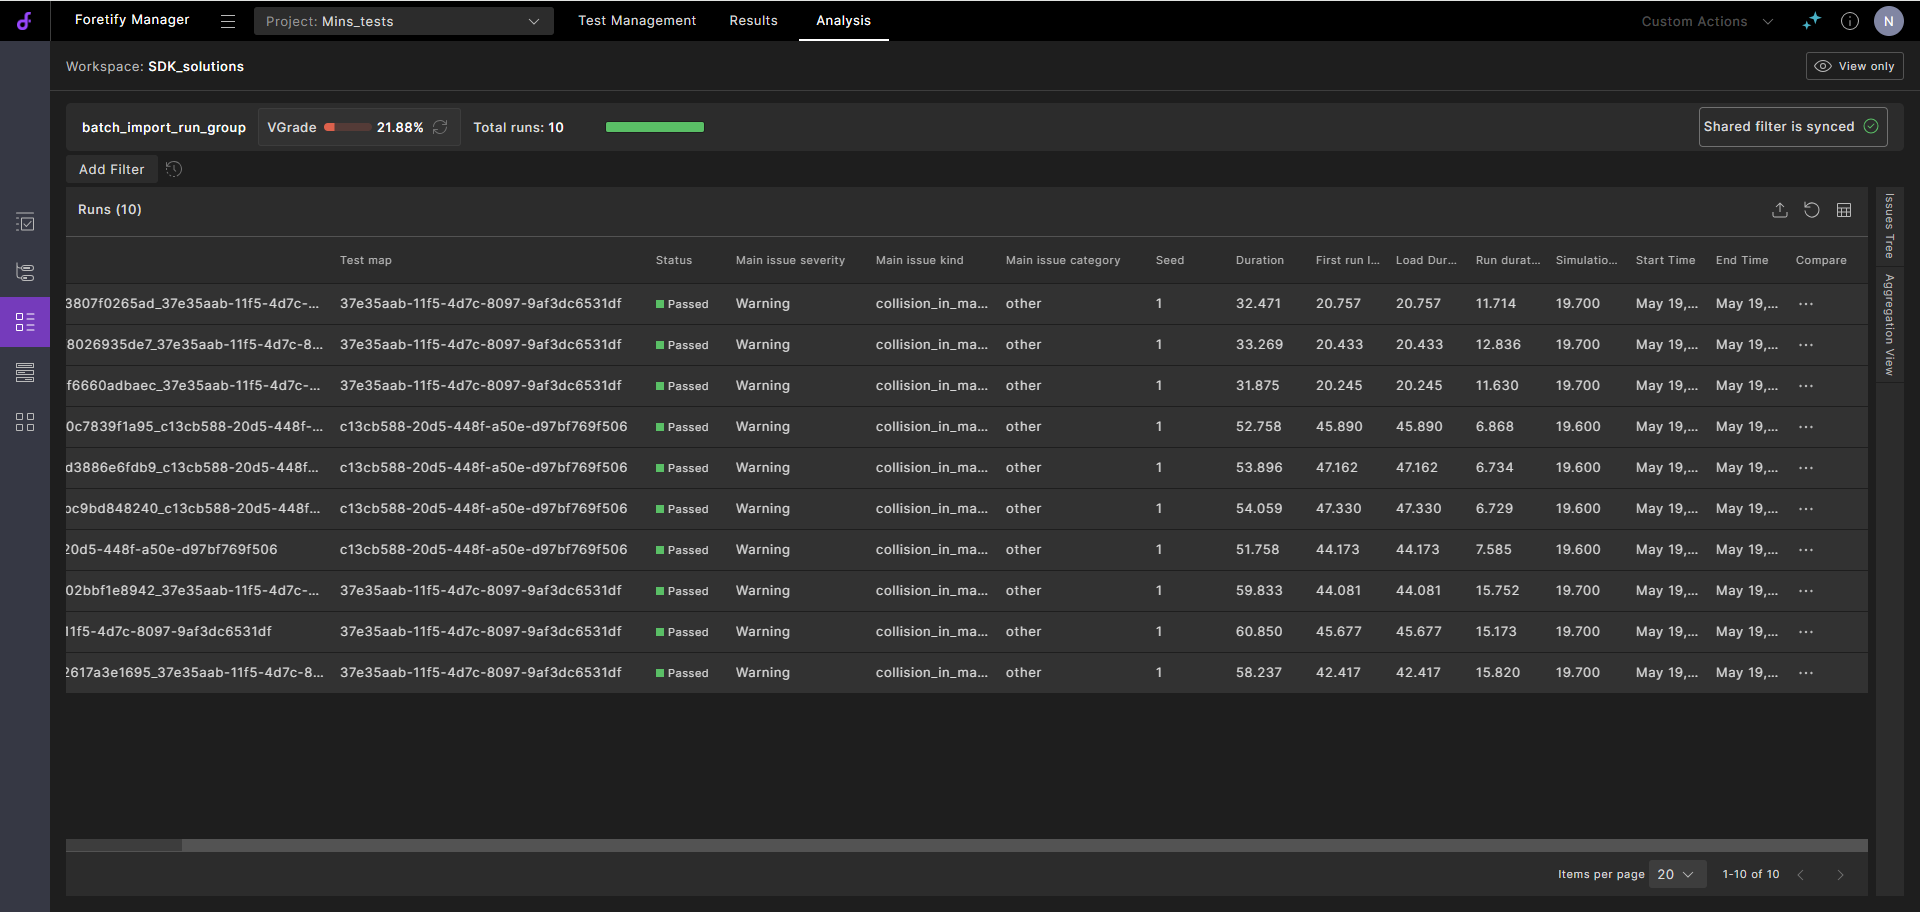
Duration is the duration of the entire run, including load, generation and simulation. This is equal to Load duration + Run duration.
Click a column heading to sort values from highest to lowest, or lowest to highest.
70.2 Identify the main issue using the Issues Tree
Foretify defines a number of global checkers that identify issues that occur during a run and display an appropriate message.
Issues are defined with a severity level ranging from info to error_stop_now. During a run, Foretify identifies the main issue — the issue with the highest severity — and collects various metrics about all issue occurrences. Foretify Manager aggregates these metrics across a test suite and facilitates analysis of common issues among the runs. This process of defining, analyzing and resolving issues is called verdict analysis.
-
In the Runs table, review the categories, severity levels, and kinds of issues in the Issues Tree.
-
To see the full message of the main issue for a run, hover the cursor over the message.
-
Click the category, severity or kind of issue you want to debug.
The Runs table refreshes to show only the runs with the selected issues.
-
If necessary, you can narrow the list of failed runs further:
-
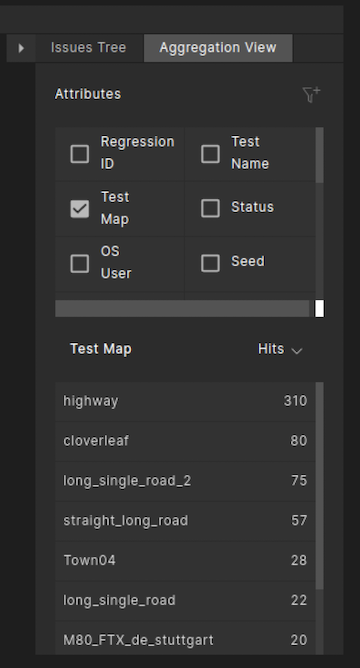
Click the Aggregation View tab next to Issues Tree.
The Aggregation View displays a list of run attributes.
-
Select a run attribute to group the runs by, for example, Test Map.
A list of maps used in the tests appears.
-
Select a map from the list to display the runs of that test that used the map you selected.
-
70.3 Debug a run in Foretify Manager
The Debug Run window is the same as the Debug Run tab in Foretify Developer. See Debug a run for details.
Note
To re-execute the run, you must download the run folder and open it in Foretify Developer.