80. Analyzing metrics
The VPlan tab of the Workspace window helps you analyze both the coverage and performance metrics captured in test suite results.
Test execution metrics cover two areas: the thoroughness of testing and the performance of the SUT. The coverage grade provides a multi-dimensional representation of all situations encountered during testing. Key Performance Indicators (KPIs) capture SUT performance data. Foretify Manager displays both in the framework of a VPlan.
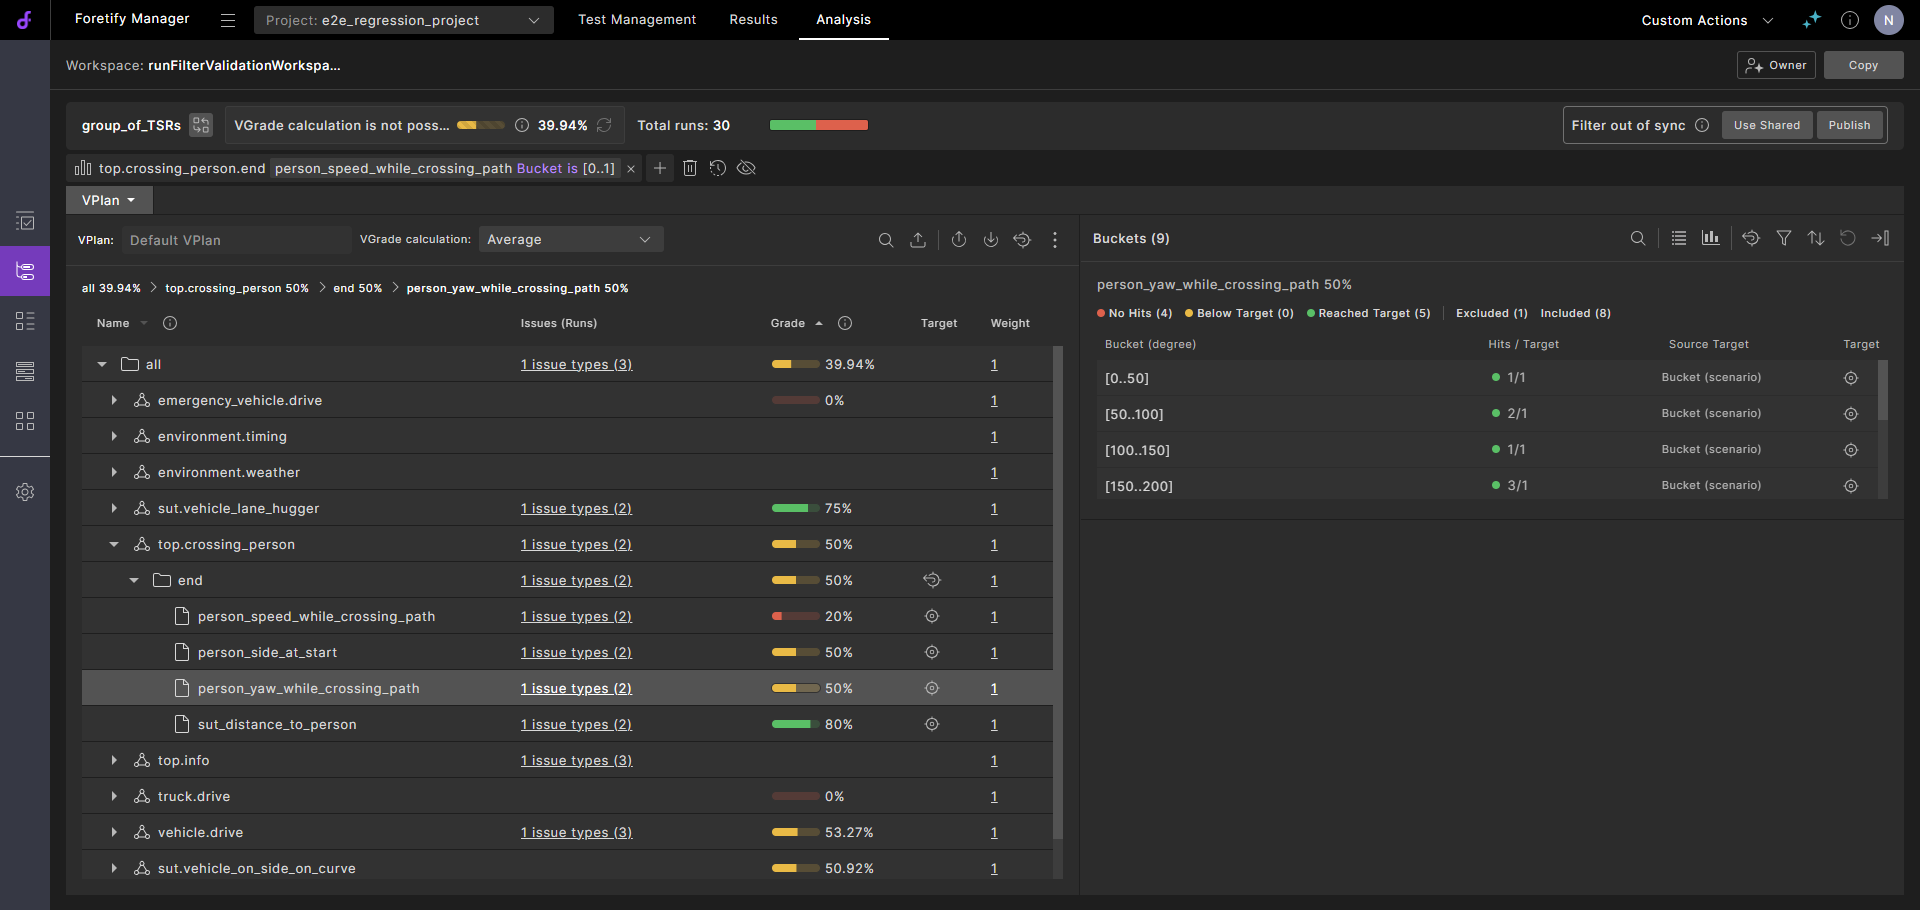
The VPlan tab displays the VPlan annotated with metrics data collected during the runs. Foretify Manager calculates the overall grade, shown in the top left, from the individual grades of all items in the metrics model. Each section and sub-section shows a grade as a percentage and on a color scale — red for low, yellow for medium, and green for high grades.
The left pane of the VPlan tab displays the coverage and performance metrics in the context of a verification plan (VPlan). When you select a metric item, Foretify Manager displays details about that item in the Buckets pane to the right.
80.1 View buckets as list
By default, buckets are displayed as a list.
The number of hits for each bucket is displayed using different colors to indicate No hits, Below target, or Reached target. Any bucket with "No hits" is considered a coverage hole and should be addressed either by adjusting test parameters to fill those buckets or by removing them from the coverage definitions.
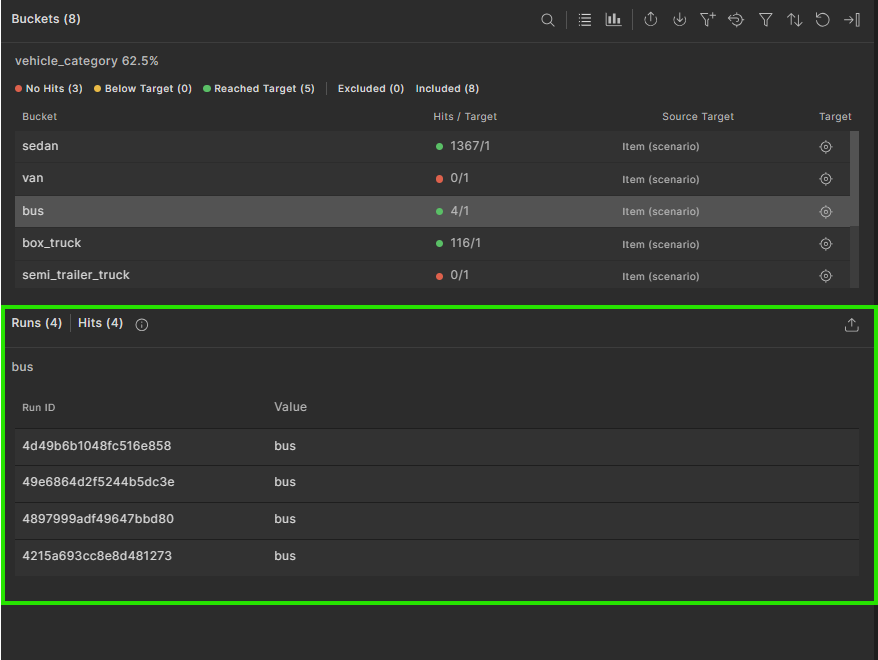
Click a bucket to display the Runs table below the buckets list.
The Runs table displays the relevant Run ID and Value [meter] which is the hit value, for each run. At the top of the table is a summary of the total number of hits for the number of runs.
To select multiple buckets and view their associated Runs, press and hold the Ctrl (or CMD on Mac) key and click each required bucket.
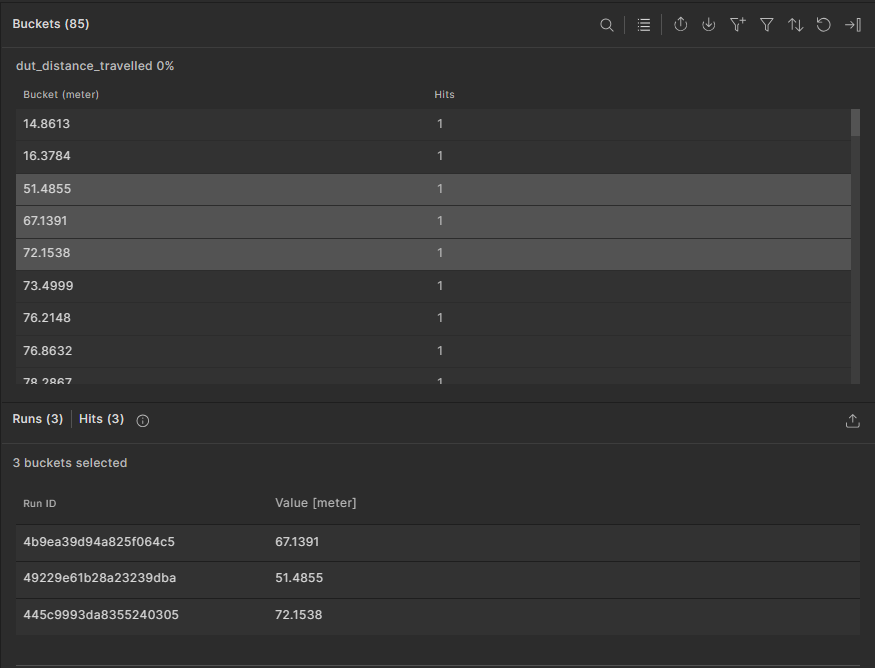
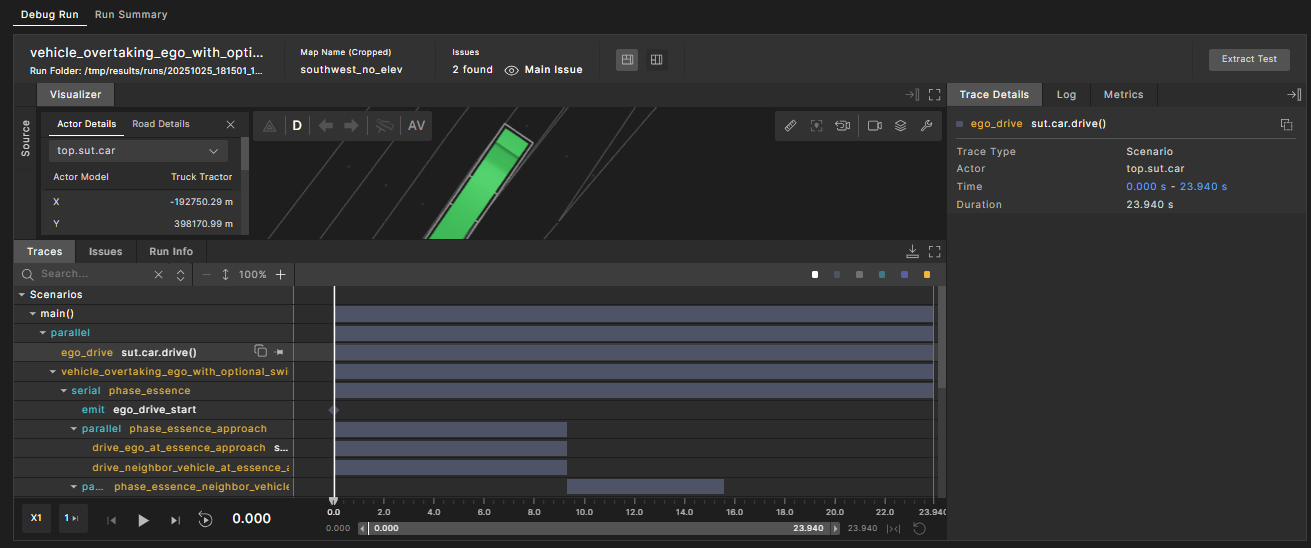
Click a Run ID to navigate to the debugger view where this coverage was recorded. This view shows the matching interval or the parent scenario, making it easier to identify and fix coverage holes.
80.2 View buckets as histogram chart
You can view the bucket data in a histogram chart. To open the chart, click the View buckets as histogram chart  icon.
icon.
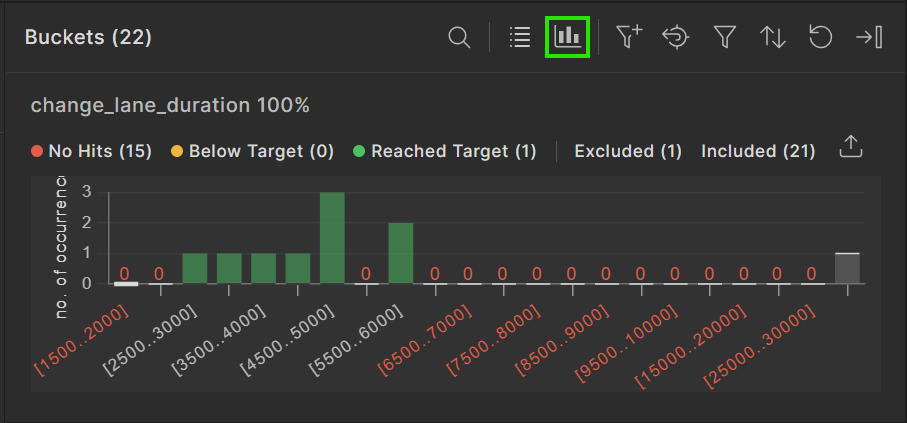
The histogram displays bucket names on the x-axis and hit counts on the y-axis. Each bucket has a target, displayed as a horizontal threshold line. The color of each bucket bar indicates its status:
- If no hits exist, a red label with 0 appears.
- If the hit count is greater than 0 but does not reach the target, the bucket bar is yellow, indicating Below target.
- If the hit count meets or exceeds the target, the bucket bar is green, indicating Reached target.
Hover over a bucket to display the exact number of hits.
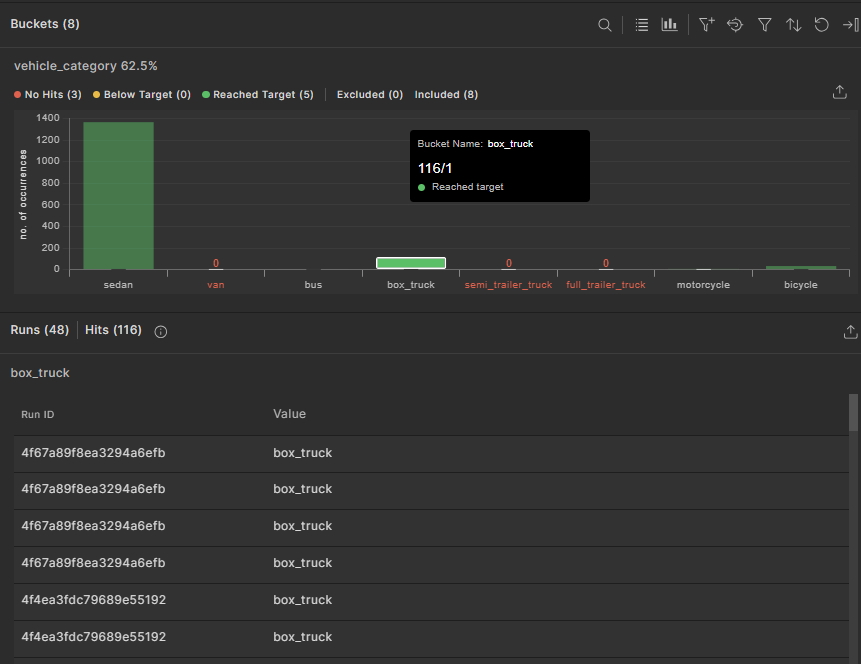
Click a bucket to display the Runs table below the histogram chart.
Click a Run ID to navigate to the debugger view, where this coverage was recorded. The view shows the matching interval or the parent scenario, making it easier to fix coverage holes.
80.3 Sort display of metric items
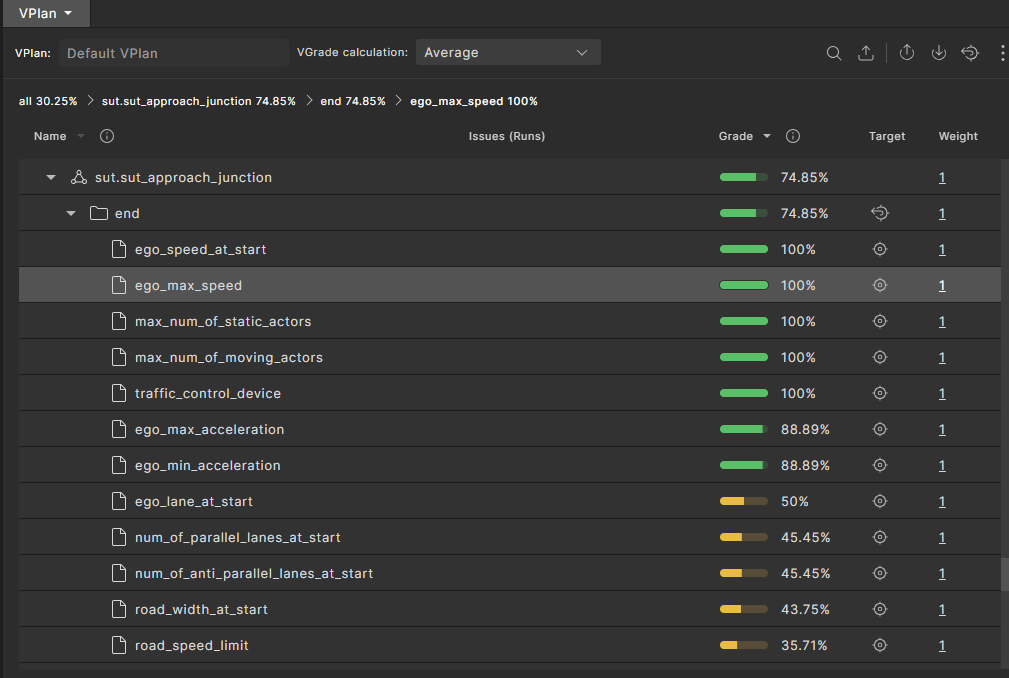
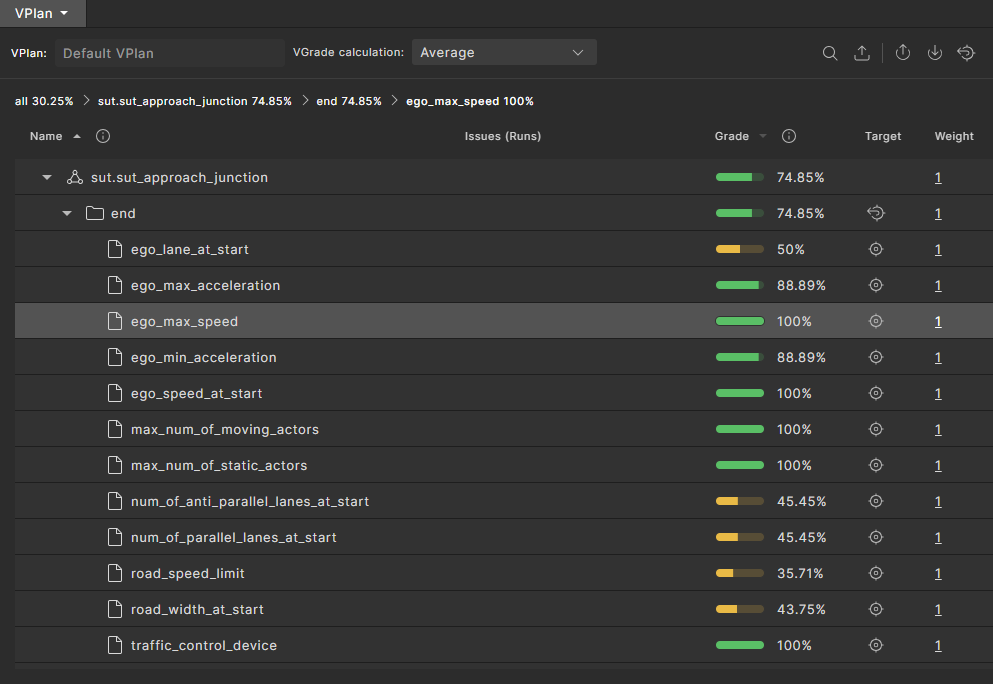
The metric items within a specific metric group can be sorted in ascending or descending order, according to Name or Grade.
Click the sort icon next to the Name or Grade headings to sort the items. The icon toggles the order each time it is clicked.
80.4 Select VGrade calculation method
You can select one of three different methods for calculating the VGrade of the workspace (the gradable nodes in the VPlan):
-
Average — the VGrade, relative to the averaging grade scheme. Each node is graded as the arithmetic average of the grade of its child-nodes. Buckets are graded as "1" if their hits reached their target, and "0" otherwise. This is the standard VGrade.
-
Binary aggregation — the VGrade, relative to the bucket grade scheme. Each node is graded as the proportion of filled buckets (hits >= target) out of the total buckets under it (the bucket predecessors). For the entire workspace, this is simply the proportion of the filled buckets out of the total number of buckets in the entire VPlan.
-
Progressive aggregation — the VGrade, relative to the progressive bucket grade scheme. This method is similar to the bucket grade scheme except it takes into account partially filled buckets. Each node is graded as the proportion of hits in the bucket predecessors out of the total targets, while hits over the target are ignored.
To select the VGrade calculation method:
-
In the workspace's VPlan tab, click the dropdown list next to VGrade calculation.
-
Select the calculation method you want from the dropdown list. Options include Average, Binary aggregation, and Progressive aggregation. See examples of these methods.
80.4.1 Example VGrade calculations
In this sample test suite, there are two items: ego_road_element_min_lanes and ego_road_element_max_lanes. The bucket targets for each item are given below:
- The
ego_road_element_min_lanesitem with a bucket target of 1 - The
ego_road_element_max_lanesitem with a bucket target of 2
To reset the bucket targets to calculate VGrade:
-
For each item, in the Buckets pane click the
 icon and select the Update Bucket Target option from the drop-down menu.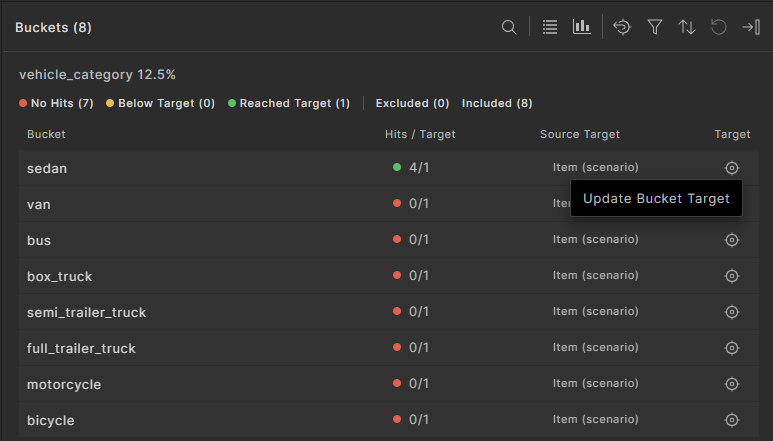
-
In the Set Target field enter a positive integer, and click Update.
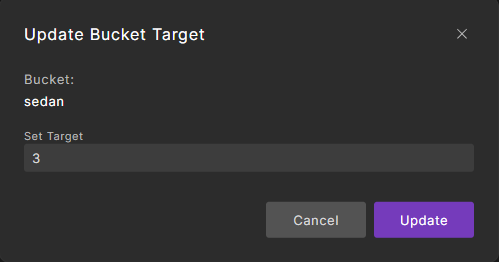
The item's grade is updated. The VGrades are calculated as follows.
Average VGrade

Binary aggregation VGrade

Progressive aggregation VGrade

80.5 Identify coverage holes
To identify coverage holes:
-
In the VPlan tab, exclude any sections of the VPlan that do not contribute to the coverage grade:
-
Select the sections.
-
Click the Exclude Selected Items icon in the top right of the VPlan tab.
The overall coverage grade is increased and the Exclude icon appears near the grade scale for each excluded entity. You can re-include them by selecting them and clicking the Include Selected Items icon in the top right of the VPlan tab.
-
-
Select an item with a low grade:
-
If you know the name of the item you want to inspect, click the Search icon in the top right of the Sections pane and enter the item’s name.
-
If you do not know the item’s name, click a section with a low grade and keep drilling down until you can click an item with a low grade.
The Buckets pane displays a list of buckets for that item. For example, for an enum such as av_side, two buckets are displayed, right and left, with the number of hits for each side.
-
-
Review the number of hits for each bucket to determine how to constrain the test to fill the coverage hole or how to remove it from the coverage definitions.
Note
You can view the breadcrumb trail at the top of the VPlan tab to see where the item is in the VPlan hierarchy. You can also click any portion of that trail to go to that level.
80.5.1 Understand item and bucket targets
The target of an item or bucket specifies the minimum number of hits the attached runs need to achieve for that bucket to be marked as complete.
The target value that is considered when grading is the bucket target if specified (in the scenario code or interactively in Foretify Manager). If not specified, the item target takes effect. If neither bucket target nor item target is specified, the target is 1.
80.5.2 Change item and bucket targets
Without having to re-run the test suite, you can change the target of an item or bucket in the VPlan tab of the Workspace for the number of coverage hits (samples) required to consider the coverage complete. This setting is displayed as the target instead of the target that was defined in the OSC2 coverage model.
80.5.2.1 Update the target for a node in the VPlan
Use the following steps to update an item's grade.
-
Click the Item Target
 icon.
icon.The drop-down menu is displayed.
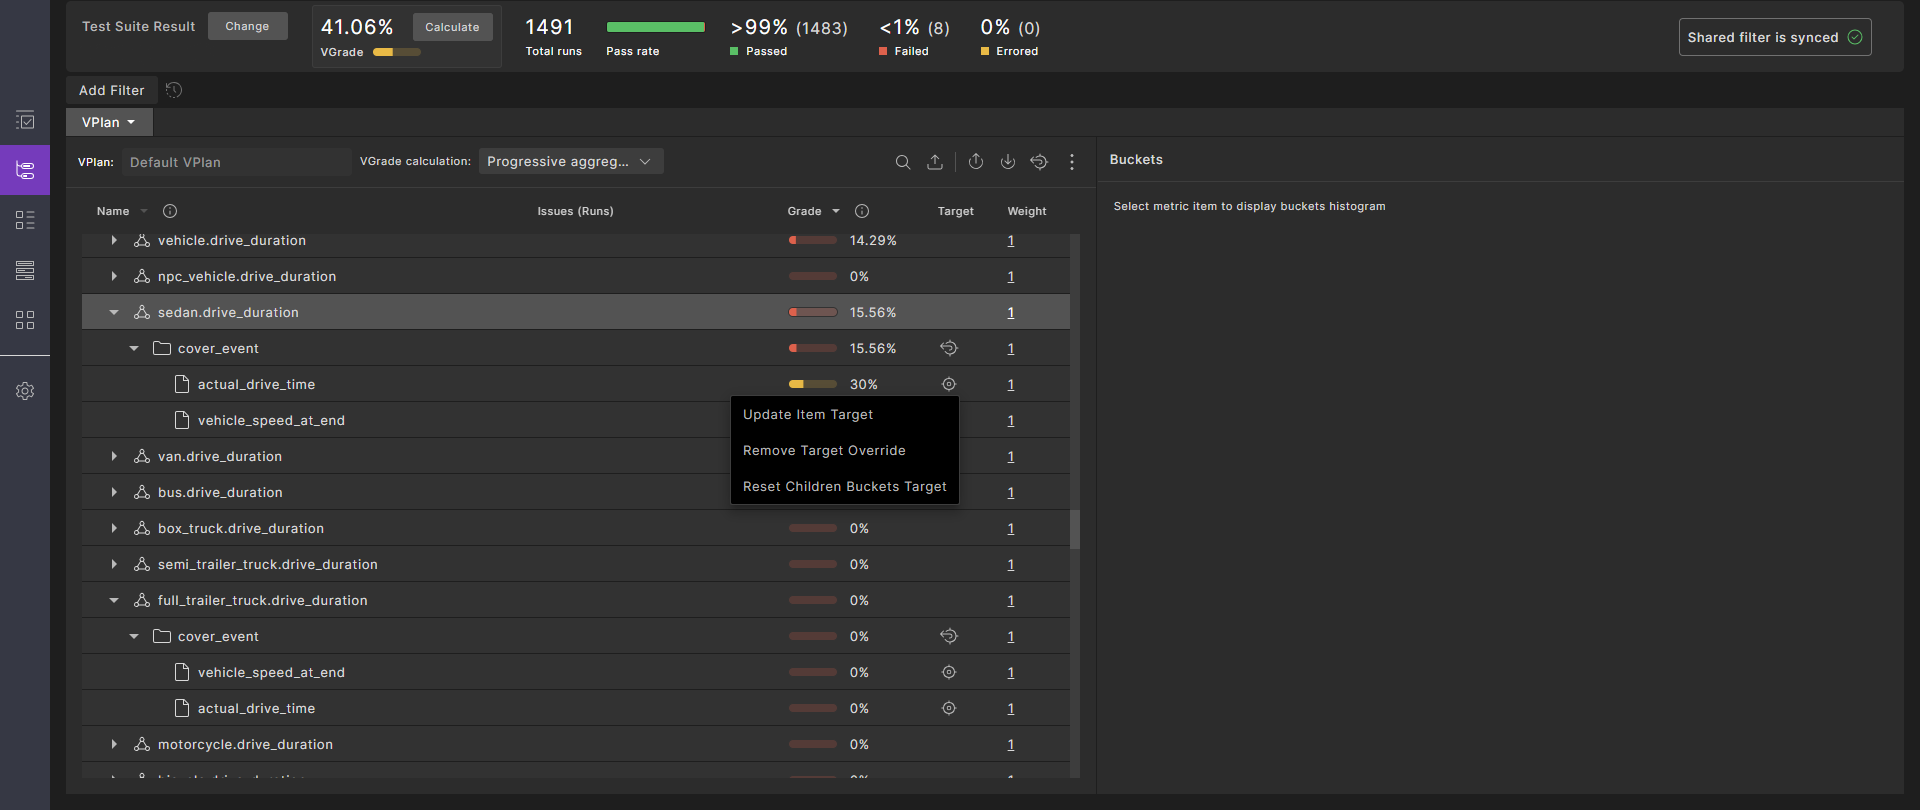
-
Click Update Item Target.
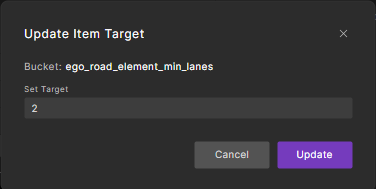
The Update Item Target dialog is displayed.
-
Enter a positive integer in the Set Target field, then click Update.
The item's grade is updated.
80.5.2.2 Reset the target for a node in the VPlan
Use the following steps to revert an item's grade.
-
Click the Item Target
icon.The drop-down menu is displayed.
-
Click Remove Target Override.
The updated target for this item is undone, and the target is reverted to the parent value (default for an item).
80.5.2.3 Reset the targets for all child buckets
This is applicable only to items.
-
Click the Item Target
icon.The drop-down menu is displayed.
-
Click Reset Children Buckets Target.
The targets for all buckets related to this item are reset. If an item target exists, it is reverted to the parent value. If no item target exists, the bucket's target is set to the default value.
80.5.2.4 Reset the targets for all items in a group
Click the Reset Children Items Target icon in the group node of the VPlan tree.
The item target values are reset. Buckets with their own targets remain unchanged, while buckets with inherited targets are reverted to the default value.
80.5.2.5 Reset the entire VPlan tree targets to default
-
Click the Item Target
icon.The drop-down menu is displayed.

-
Click Reset Children Buckets Target.
All item-level and bucket-level targets are reset to their default values.
80.5.2.6 Reset all target overrides in the VPlan
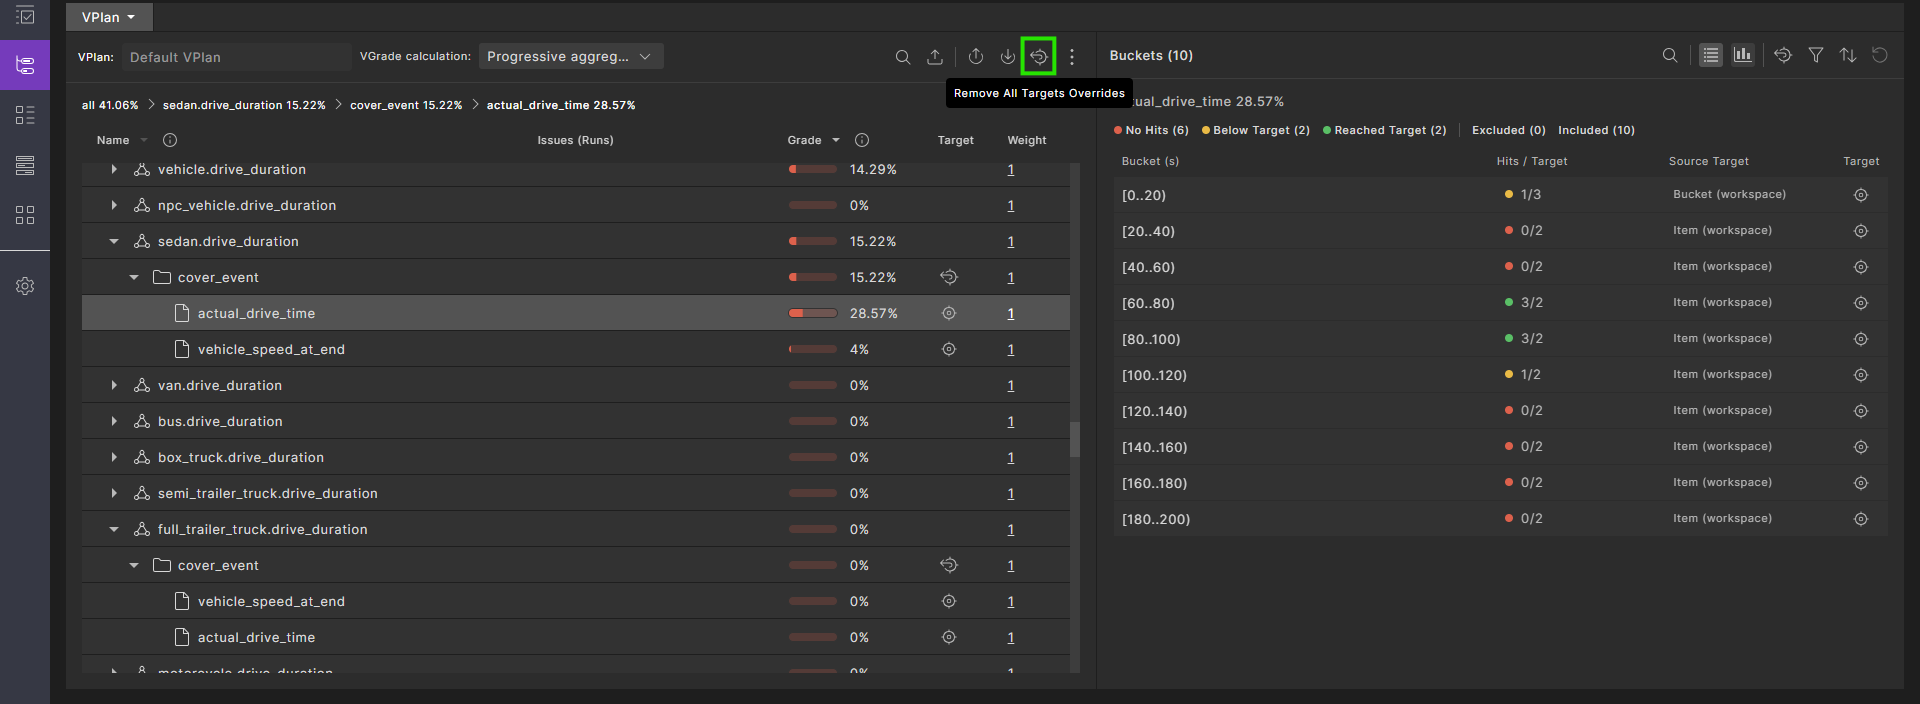
To reset all targets to the original, click the Remove All Targets Overrides icon:
80.5.2.7 Reset buckets targets
-
To reset all bucket targets, in the Buckets pane click the Reset All Buckets Targets
icon.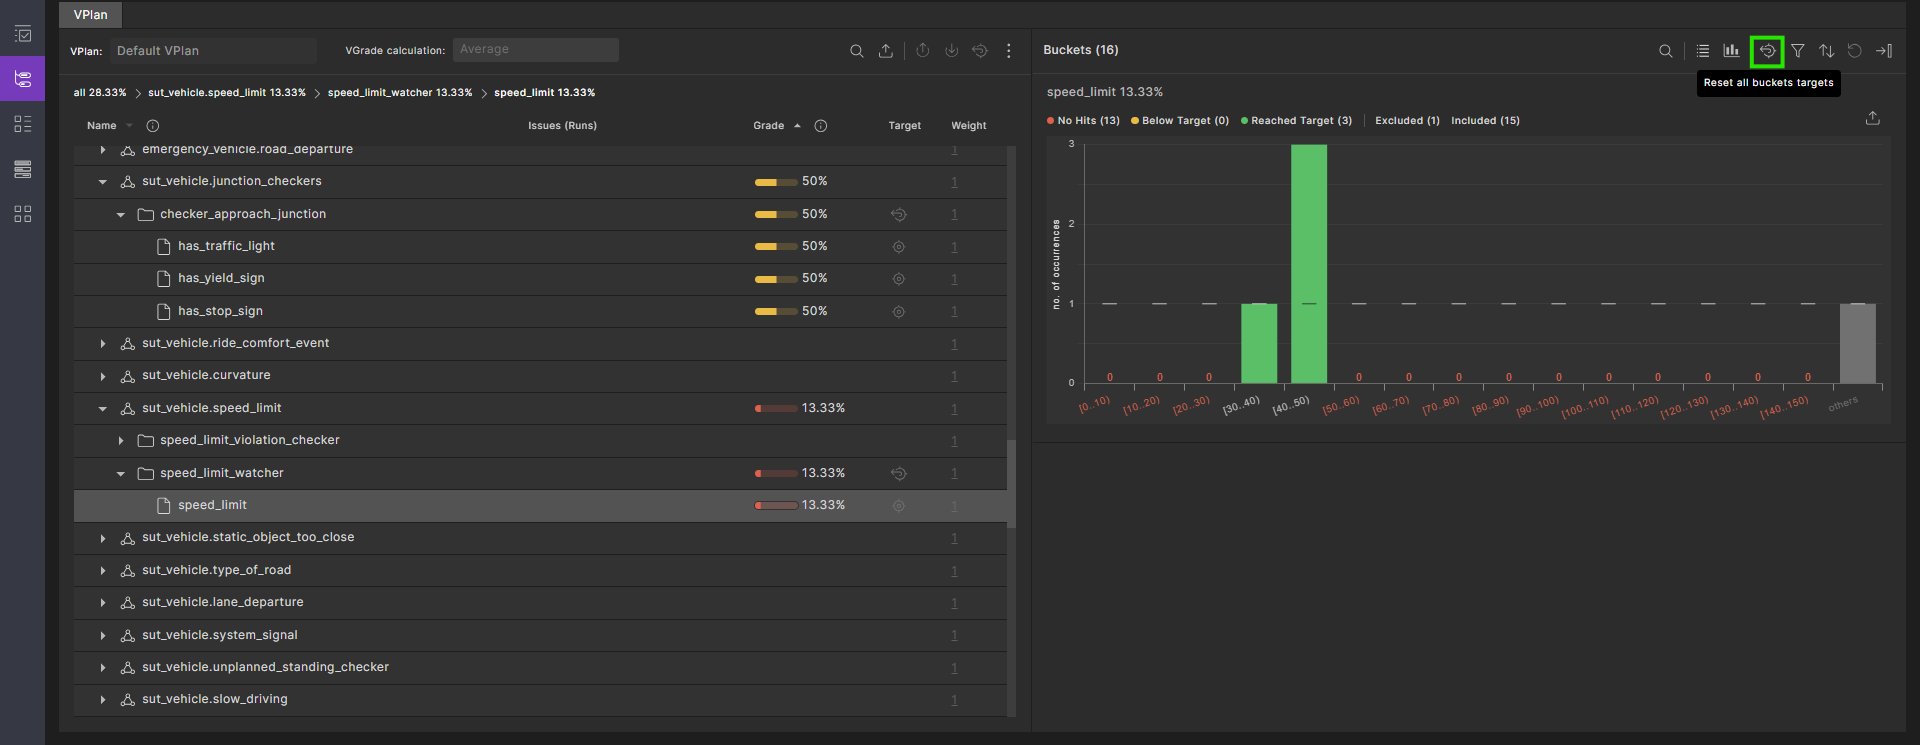
-
After resetting all buckets' targets, to reset a specific bucket's targets, in the Buckets pane click the
icon and select the option from the drop-down menu: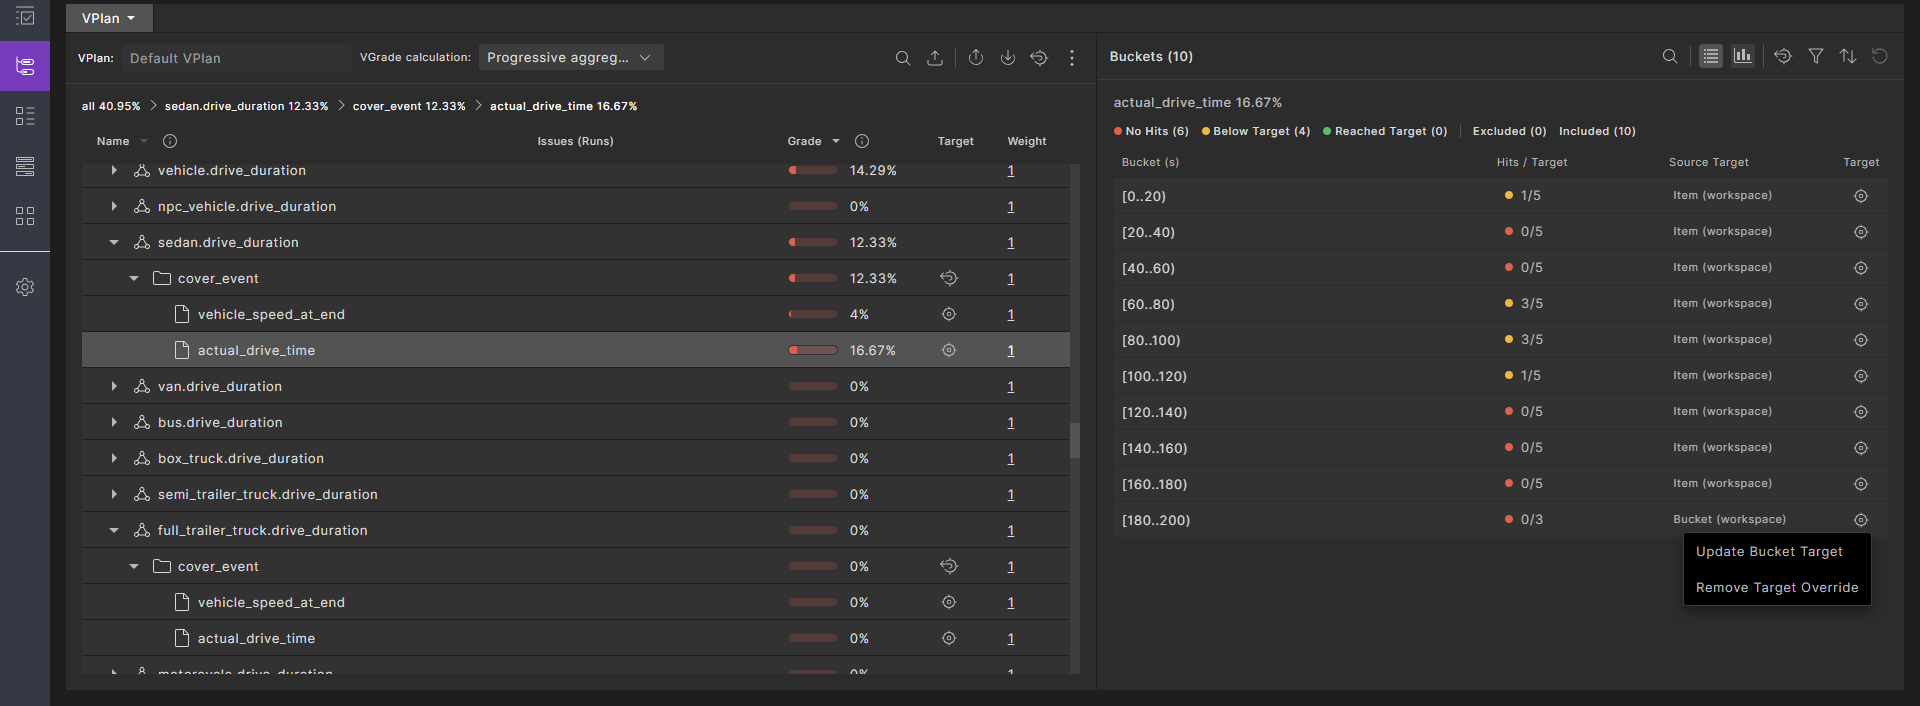
- Click Update Bucket Target to update a bucket's grade.
- Click Remove Target Override to revert a bucket's grade.
80.5.3 Filter and sort buckets
You can filter and sort the buckets displayed in the Buckets pane using the icons at the top right of the pane. You can also exclude or include selected buckets.
-
Filter — select from the available options:
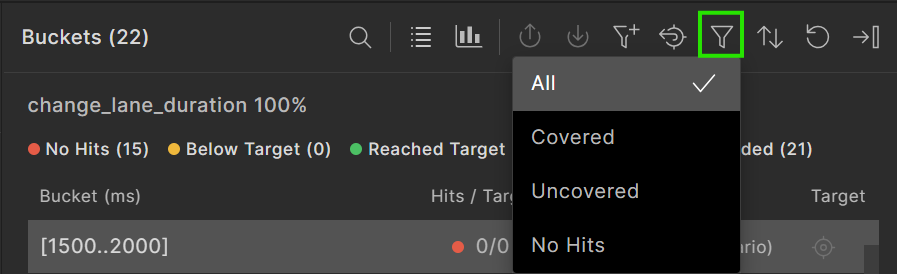
- All
- Covered
- Uncovered
- No hits
-
Sort — sort the display according to:
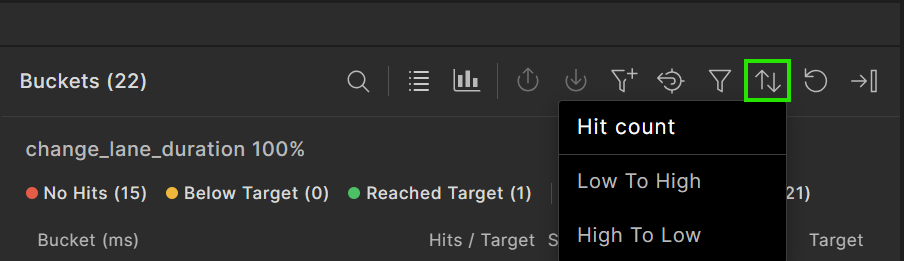
- Hit count
- Low to High
- High to Low
-
Reset — resets the buckets displayed to the default view.
See also Filter runs by bucket values.
80.5.4 Record item hits
Record metric items (KPIs), marked with a meter icon and located under their associated event, capture data or metrics during the scenario execution. Record items do not contribute to coverage (i.e. they do not affect the VGrade).
The list of record hits can be very long, as hits may occur multiple times during a run over the entire test suite result. Therefore, only the first 100 uploaded hits are retained for a record item in the VPlan.
To retrieve all the record item hits, you can iterate over the test suite result runs and extract them using the SDK. For more information, see get_item_buckets().
Note
Record items in a VPlan contain a sample of up to 100 hits. To retrieve all hits, you need to iterate through and analyze all runs.
80.6 Modify filters and tags
In the VPlan, Runs, and Intervals tabs of the Workspace, you can create three kinds of filters:
-
Run filters — Filter runs based on run attributes such as Status or Main Issue Category.
-
Metric filters — Filter VPlan items based on their group sampling event.
-
Interval filters — Filter intervals based on the provided data.
80.6.1 Create a run filter
In the Runs tab, you can filter runs based on your requirements. For more information, see Creating and publishing filters in workspaces.
80.6.2 Delete run or item filters
To delete all current filters, click the Remove All Filters (Delete) icon.

80.6.3 Filter runs by bucket values
You can also filter runs using the bucket values for a selected item.
To view runs with the same value for a particular bucket:
-
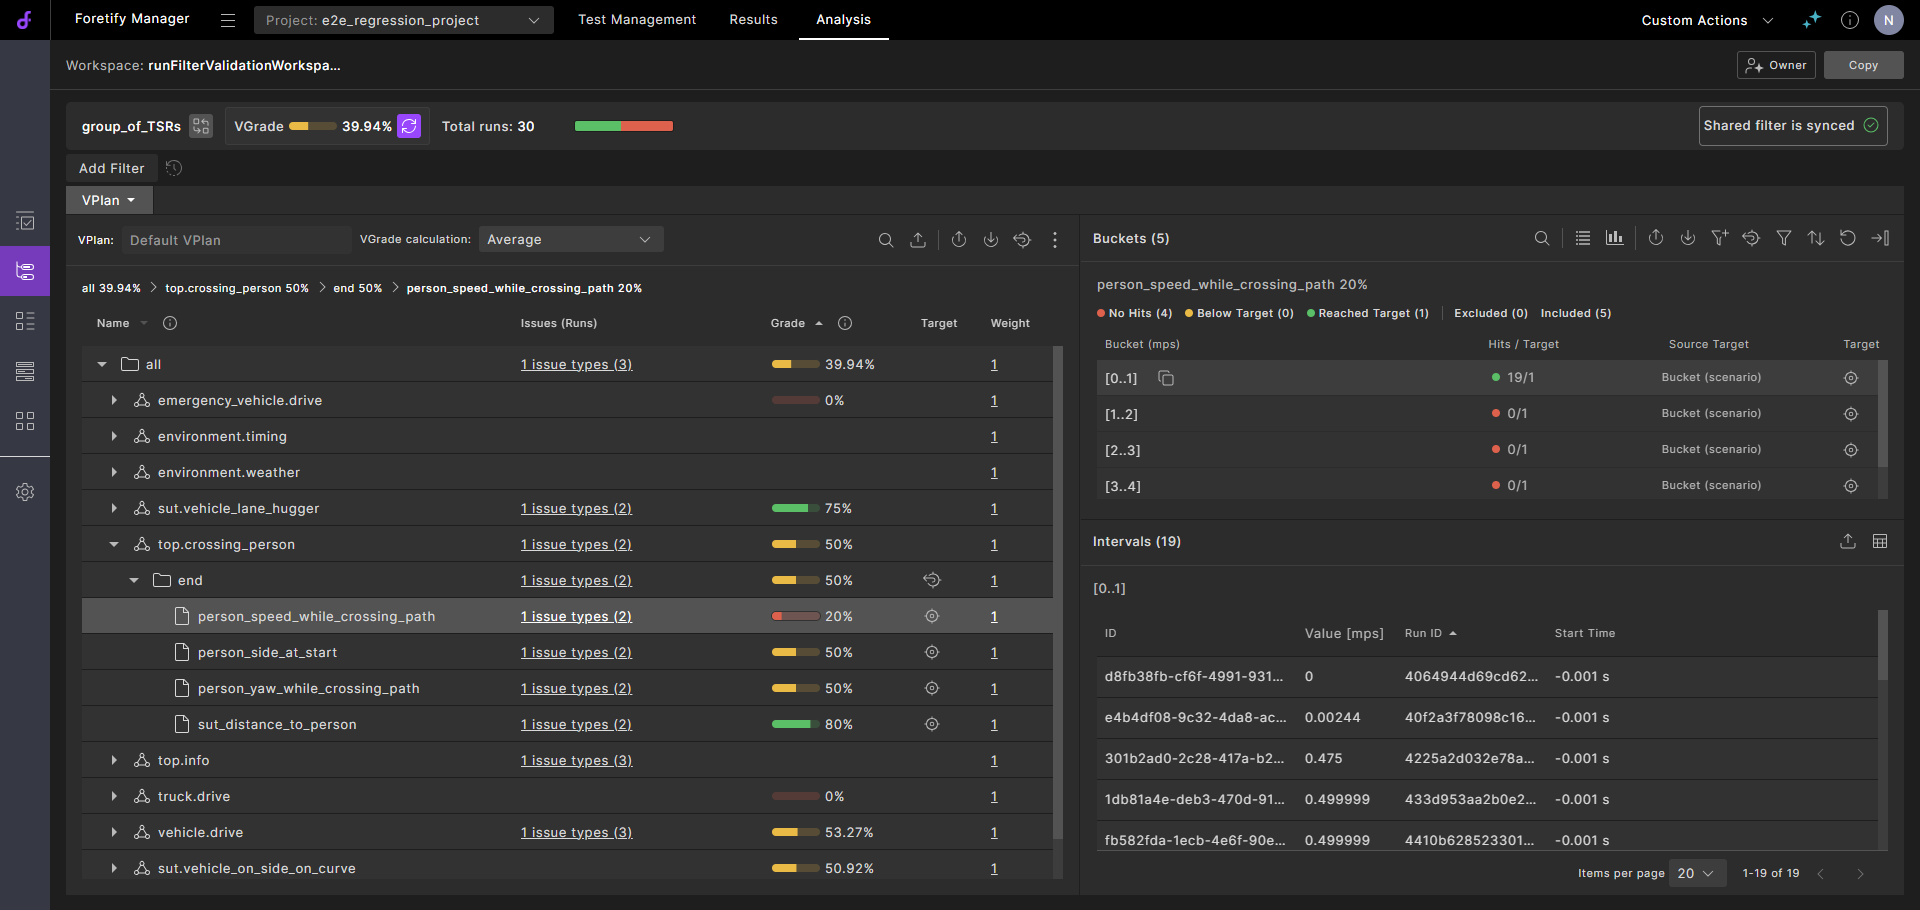
Click the name of an item in the VPlan.
-
In the Buckets pane, select the bucket value for the runs you want to see.
-
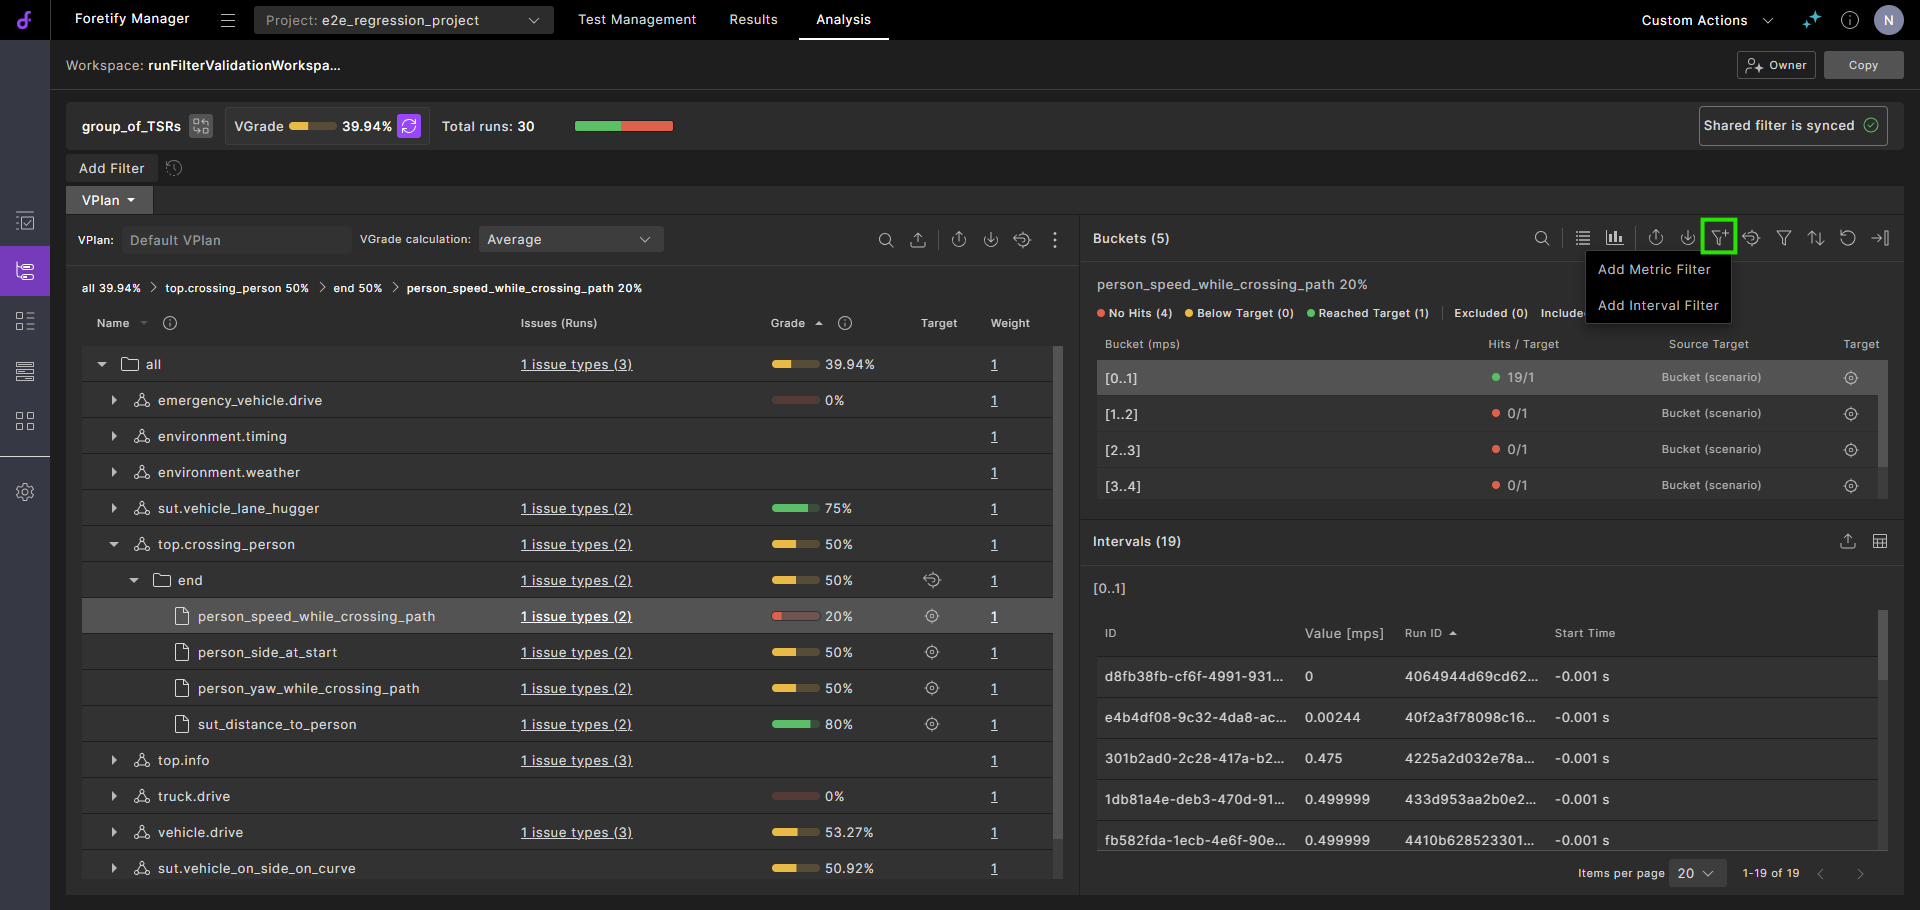
Click the Add to Filters icon.
-
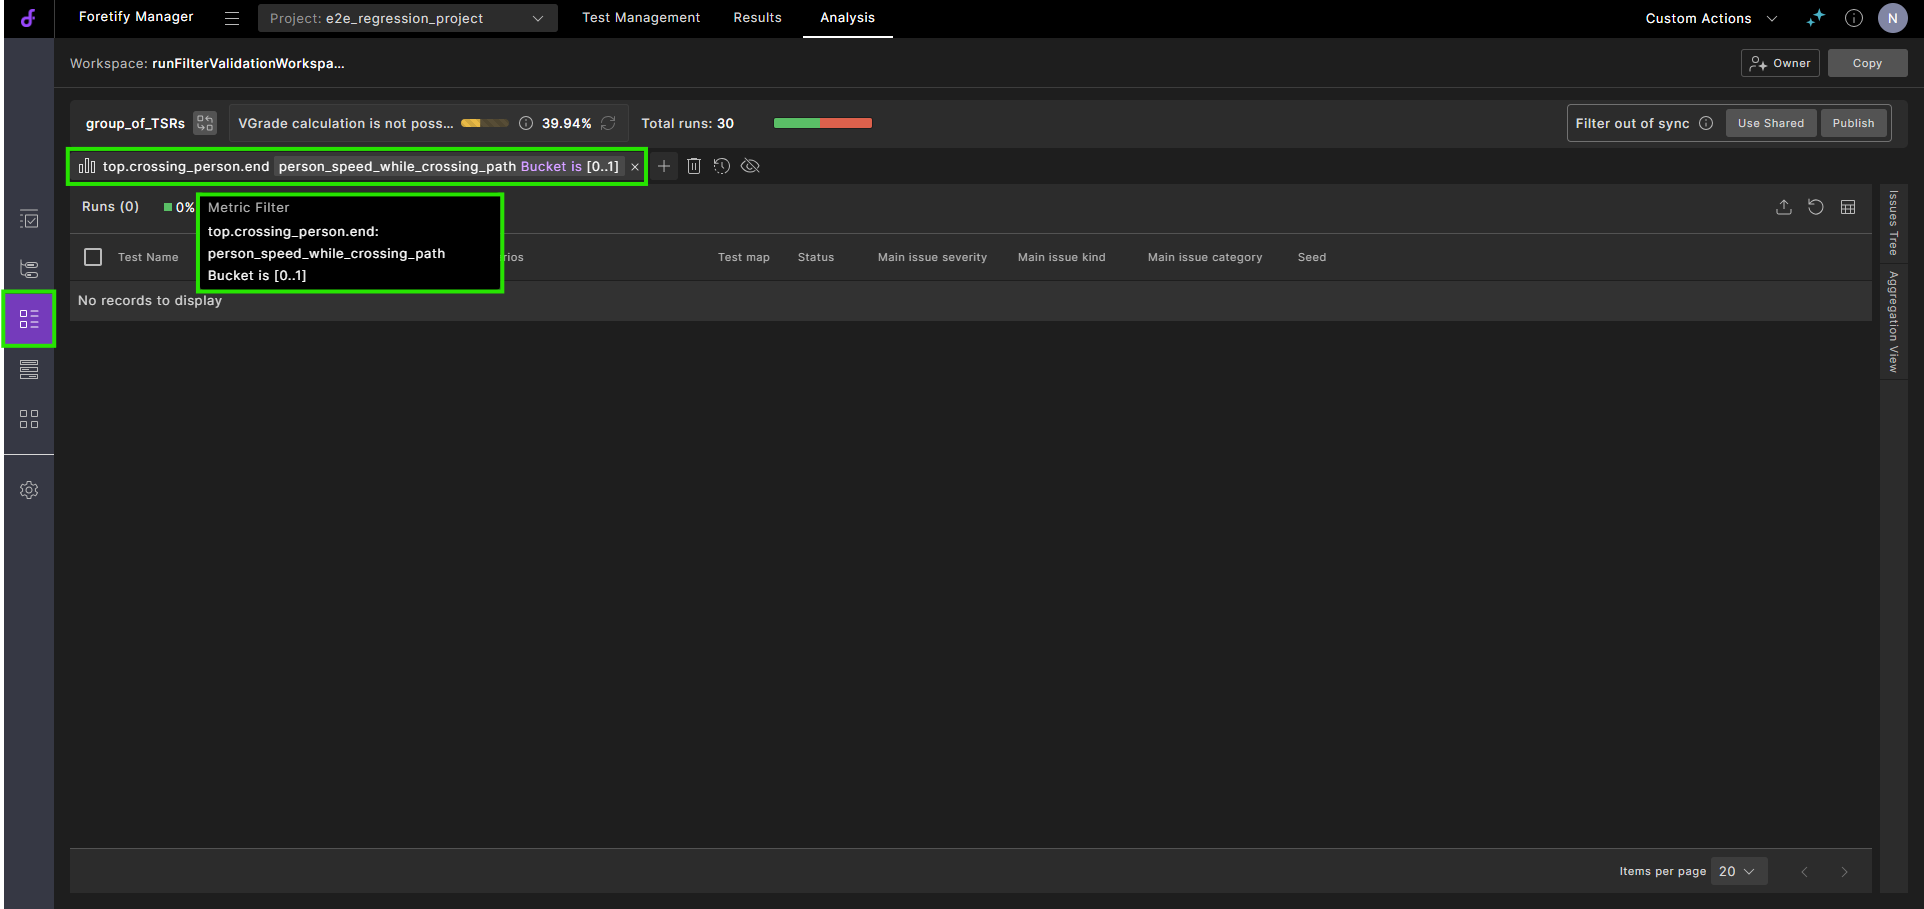
Click the Runs tab to view the runs with the specified bucket value.
80.6.4 Create or delete VPlan attribute filters
VPlan attribute filters let you selectively view VPlan sections based on attribute values. For example, you can do the following:
-
In the VPlan Editor, create a custom attribute, such as
MATURITY_LEVEL, with appropriate predefined values such as high, medium and low, or 1, 2 and 3. See Create a custom VPlan attribute. -
In the VPlan Editor, apply the attribute with a specific value to each appropriate VPlan section. See Modify section attributes.
-
In the workspace, filter the VPlan to see sections with a specific maturity level. This task is described below.
To apply a VPlan attribute filter:
-
In the VPlan tab, click the More options
 icon, and then select the Filter VPlan.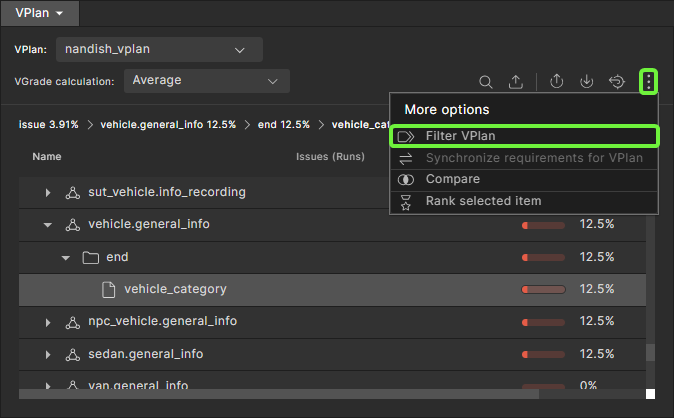
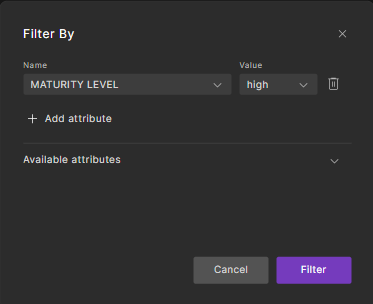
The Filter by dialog box appears.
-
Click Add Attribute.
-
In the Available attributes list, select the attribute you want to filter by, and then select its value.
-
Click Filter.
The sections with the attribute value you filtered and displayed in the VPlan tab.
To delete a VPlan attribute filter:
-
Click the Filter VPlan icon.
The Filter by dialog box appears.
-
Click the Trash icon next to the filter you want to delete.
-
Click Filter.
80.6.5 Create a tag
When you create a tag, the runs selected by the current set of filters are tagged with the specified name. You can now filter the Runs tab to find runs with the specified tag.
To create a tag from the Current tab of the Filter pane:
- Click the Create Tag icon on the top right of the Filter pane.
- Type a name in the box and press Enter.
To create a tag from the History tab of the Filter pane:
- Click the Tag icon.
- Select the date and time the filter was created from the list.
- Type a name in the box and press Enter.
80.6.6 Restore a filter or tag
To restore a previously created (but not tagged) filter:
- Click the History tab in the Filter pane.
- In the chronological list, click the date and time of the filter you want to see.
- Click Apply.
- Click Annotate.
80.7 Rank runs
The ranking feature answers the following question: given a metric (or a collection of metrics represented by a section/scenario/group) and its coverage grade, what is the minimal subset of runs required to achieve this coverage grade?
The results of ranking is a list of runs with an additional attribute called Cumulative Grade. This is the minimal subset, showing how they contribute to the related coverage grade.
You can use this feature to reduce computing resources.
To rank runs:
-
In the VPlan tab, select the coverage section, scenario or group whose runs you want to rank.
-
Click the More options
icon, and then select the Rank selected item icon.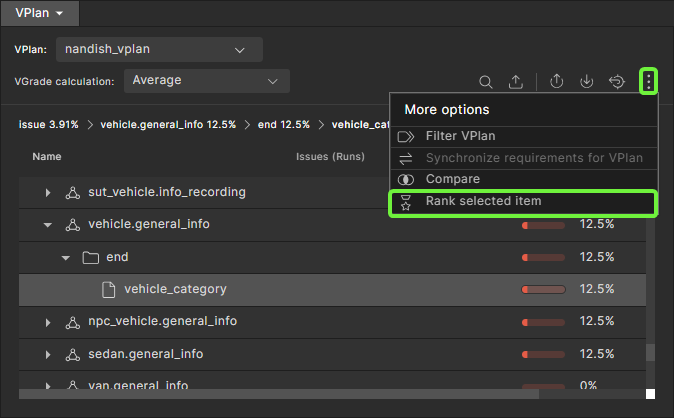
-
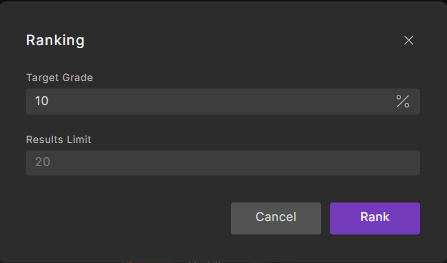
In the dialog box, type in the target for the ranking, either the cumulative grade to be reached (in the field labeled Target Grade) or the number of runs to be included (in the field labeled Results Limit).
-
Click Rank.
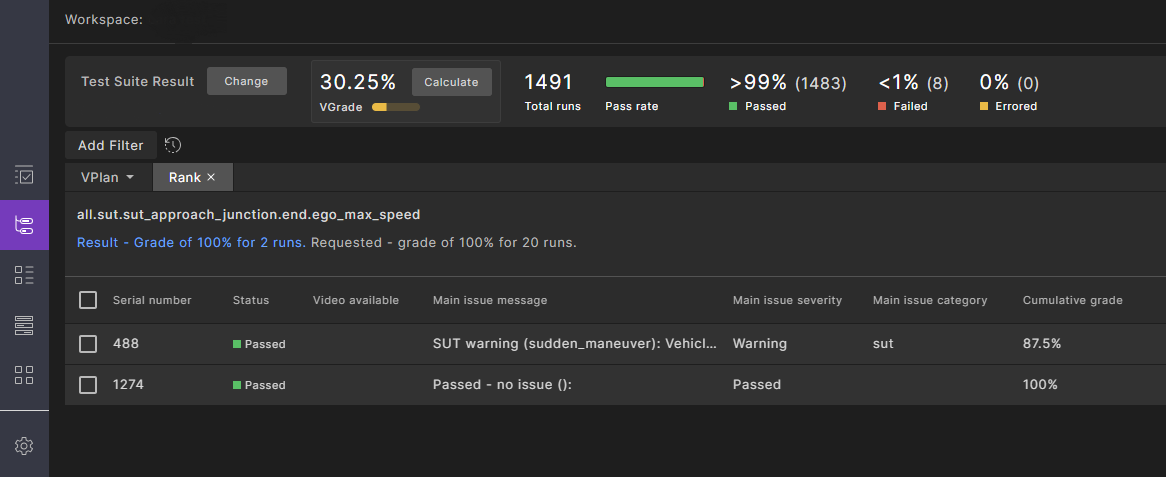
The Rank tab opens, with an indicator showing the progress of the ranking operation. You have the option of clicking the Stop button if you don't want to wait for the ranking to finish.
-
When the Rank tab appears, review the summary at the top and the list of runs.
The summary shows the resulting grade and number of runs along with the requested grade and number of runs.
-
To export a CSV file in a format that FRun can consume, click the Export icon and select Export to FRun Format. The CSV file appears in your Downloads folder.
80.8 Export workspace result in JSON format
To export the workspace results, including the full VPlan tree with all items and bucket results, click the Export icon  on the toolbar.
Workspace result example:
id: "43399ea3ded3c9996cd4"
name: "eran_componnd_bug_bash"
vplanTemplateId: null
metricModelId: "4718b3a79c59ec6b77ca"
runsFilter: { logicalOperator: "AND", elements: (1)[…] }
grading { averagingGrade: 0, bucketGrade: 0, progressiveBucketGrade: 0 }
totalRunsCount: 20
description: ""
updateCoveragePerRunsStatus: "ALL_RUNS"
currentTimelinePointId: "46f39f80938047988023"
isUserViewAligned: true
lastPublishedBy: null
currentTimelinePointName:   "daily_bundle_develop_1679_dev_u22.04-6974705685614230402" calculatedVplanName: null
localTotalRunsCount: 0
localFailedRunsCount: 0
localErroredRunsCount: 0
localPassedRunsCount: 0
sections    { all: {…} }
80.9 Control the metrics model used to calculate the coverage grade
By default, the coverage grade of the selected test suite result is calculated based on the metrics defined in scenarios that were simulated by the most recent test suite result uploaded to the workspace. There may be cases where you need to calculate the coverage grade of a test suite result based on a different (manually selected) metrics definition. For example, you might want to evaluate the coverage grade of an older test suite result, based on the metrics model that was created for that same test suite result.
To set the metrics model used to calculate the coverage grade:
-
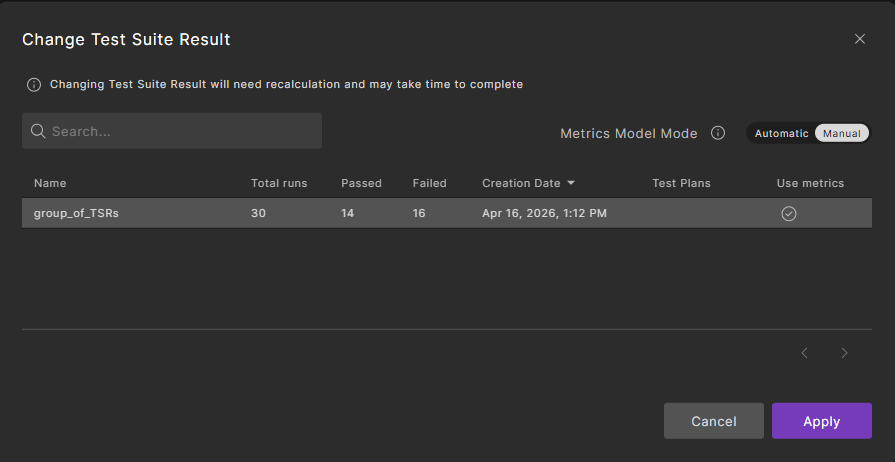
Click the Change button located in front of Test Suite Result.
The Change Test Suite Result dialog is displayed with a list of the test suite results in the workspace. Here, the Use Metrics column shows which test suite result metric model is used to calculate the VGrade. In Automatic mode, changing the selection under the Use Metrics column is disabled. In Manual mode, changing the selection is enabled.
-
Change the Metric Model Mode from Automatic to Manual.
-
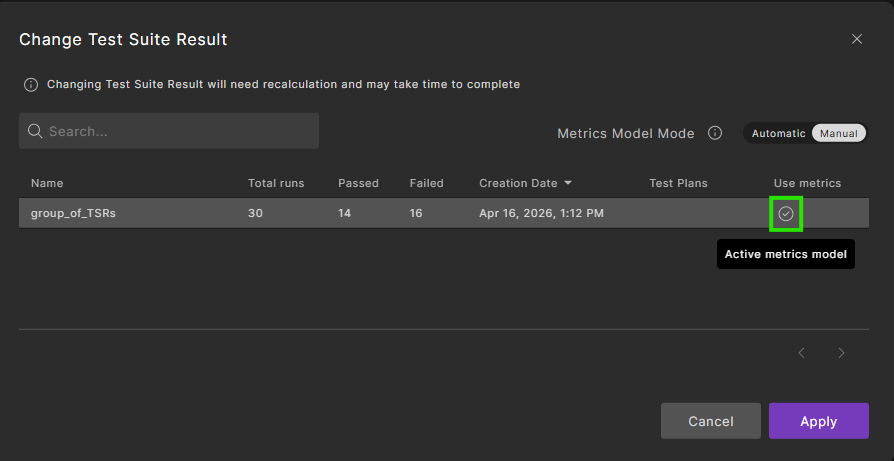
Set the metrics model by clicking the checkmark next to the required test suite results for coverage analysis.
-
Click Apply.
-
Click Calculate to recalculate the coverage grade.
80.10 Compare metrics across test suites
You can compare a value of a metric, either coverage or KPI, across multiple test suites. This feature is useful when evaluating progress over time.
To compare metrics collected across multiple test suites:
-
If you want to compare only selected runs across test suites:
-
Click the Show Filters icon on the top right of the VPlan.
-
Create a filter or apply the appropriate tag for the runs that you want to see.
-
-
In the VPlan, select the node whose results you want to compare.
Comparisons are performed recursively, so child nodes of the selected node are included in the comparison results. You can filter out irrelevant nodes later.
-
Click the Compare icon at the top of the VPlan.
The Compare dialog box opens, displaying a list of test suites to choose from.
-
Select one or more test suites whose results you want to compare and click Compare.
The Comparison tab opens, with an indicator showing the progress of the comparison. You have the option of clicking the Stop button if you don't want to wait for the comparison to finish.
When the comparison completes, the tab shows the current test suite results in the Current column and the results of the test suites you selected in the following columns.
By default, the comparison is filtered to show items or aggregations that differ more than 0%.
-
(Optional) To change the filter, click the Filter Results icon at the top right of the Comparison tab.
- In the Filter Results dialog box, keep Show only diffs larger than selected and type in a different number.
- Turn off Show only items/aggregations to show all types of items.
-
To export the comparison, click the Export to Table Format icon at the top right corner of the Comparison tab.
80.11 View global metrics
Global metrics are predefined attributes that are collected for every run in a test suite. They include:
- The SUT name and version
- The Foretify version
- The simulator name and version
- The map name and source location
These metrics are collected and categorized in the top.info struct accessible from the VPlan tab of the Workspace.
For a detailed description of these metrics, see Global metrics.
To view the global metrics:
-
In the VPlan tab, click the top.info node to expand it.
-
In the top.info section, click the model node to expand it.
When sut_name is selected, the SUT used in the test suite is displayed with the number of runs for each one.
When simulator_name is selected, the simulators used in the test suite are displayed with the number of runs for each one.
-
In the top.info section, click the run item to expand it.
When map is selected, the maps used in the test suite are displayed with the number of runs for each one.
Notes
- KPIs are displayed with a meter icon before the KPI name.
- User-defined KPIs (aggregation items) are collected under the scenario and event where they are defined.
- If you added user-defined global metrics to your test suite, they appear under
top.info, then under the event used to record the variable for the global metric. See Add global metrics in the Foretify documentation to learn how to create global metrics.