Analyzing Test Suite Results
Use the Workspace Test Suite Results page in Foretify Manager to monitor verification progress over time within a specific workspace. Review pass rate and VGrade trends together for a complete picture of verification status — a high pass rate with a low VGrade may indicate insufficient coverage. Use filters to focus on specific areas, and check the VPlan Version column to identify results that may need recalculation.
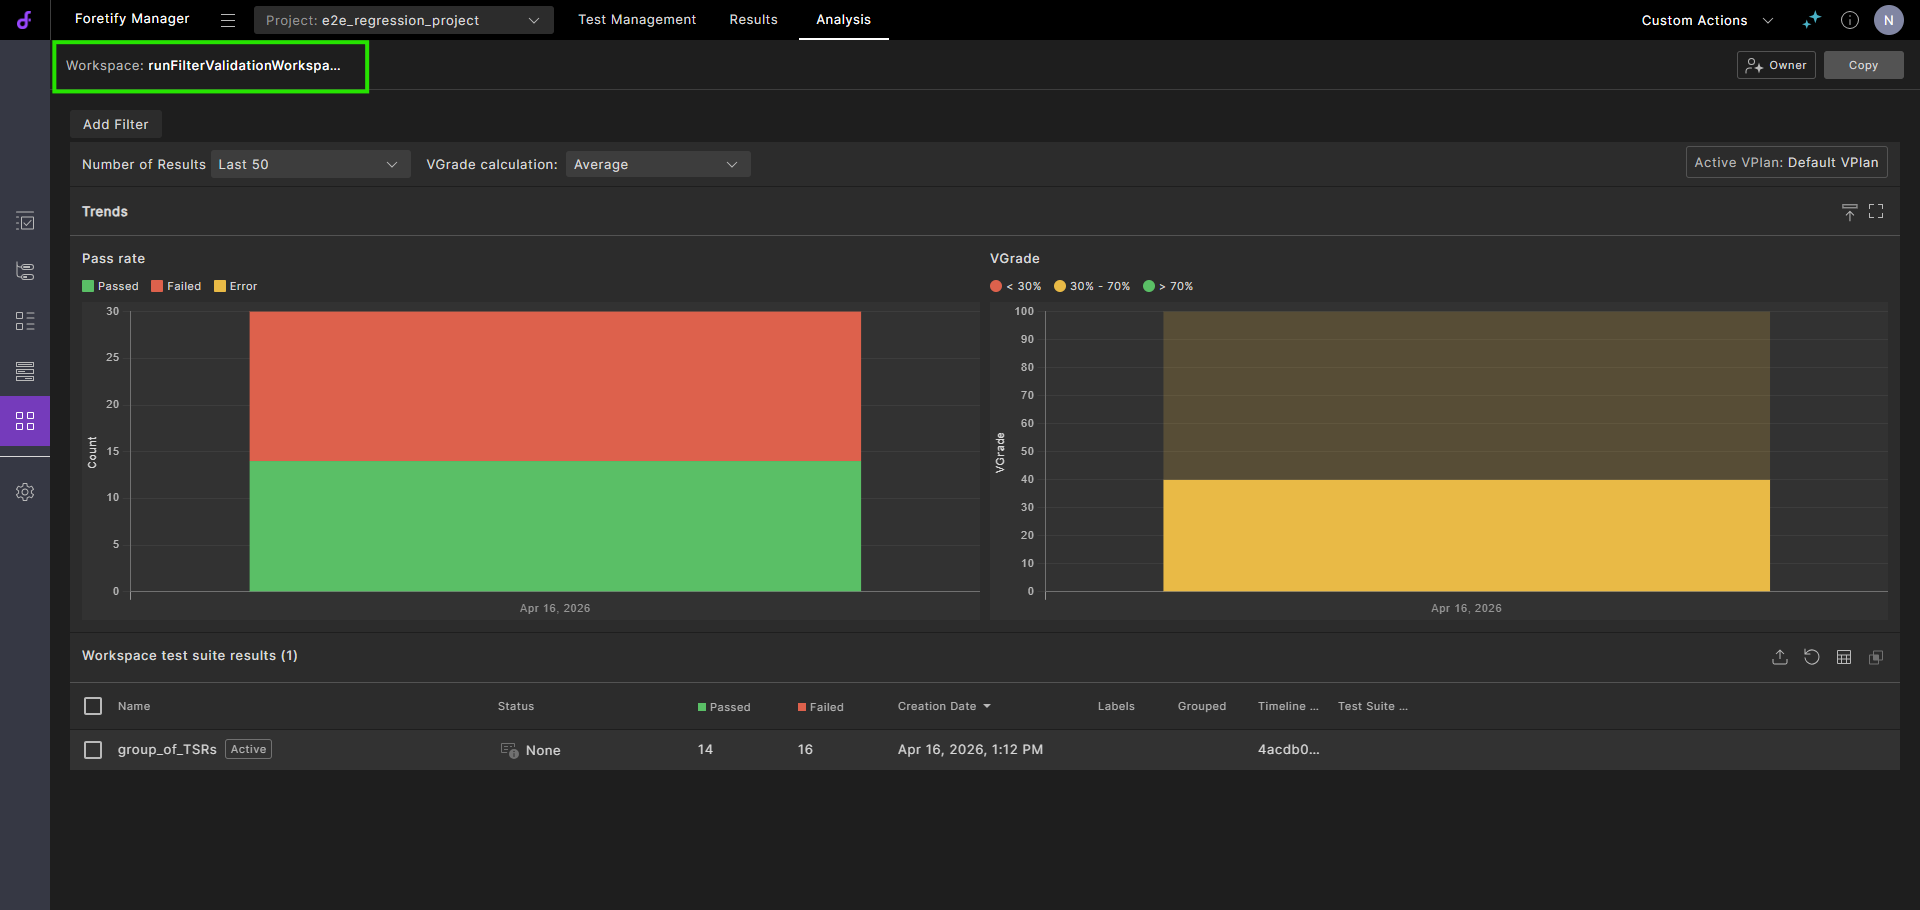
Click the Workspace Test Suite Results  left menu option to open the Workspace Test Suite Results view.
The workspace name appears at the top of the page, and all displayed trends and results are scoped to that workspace.
Filtering Workspace Test Suite Results
Customize the display using the available filters:
-
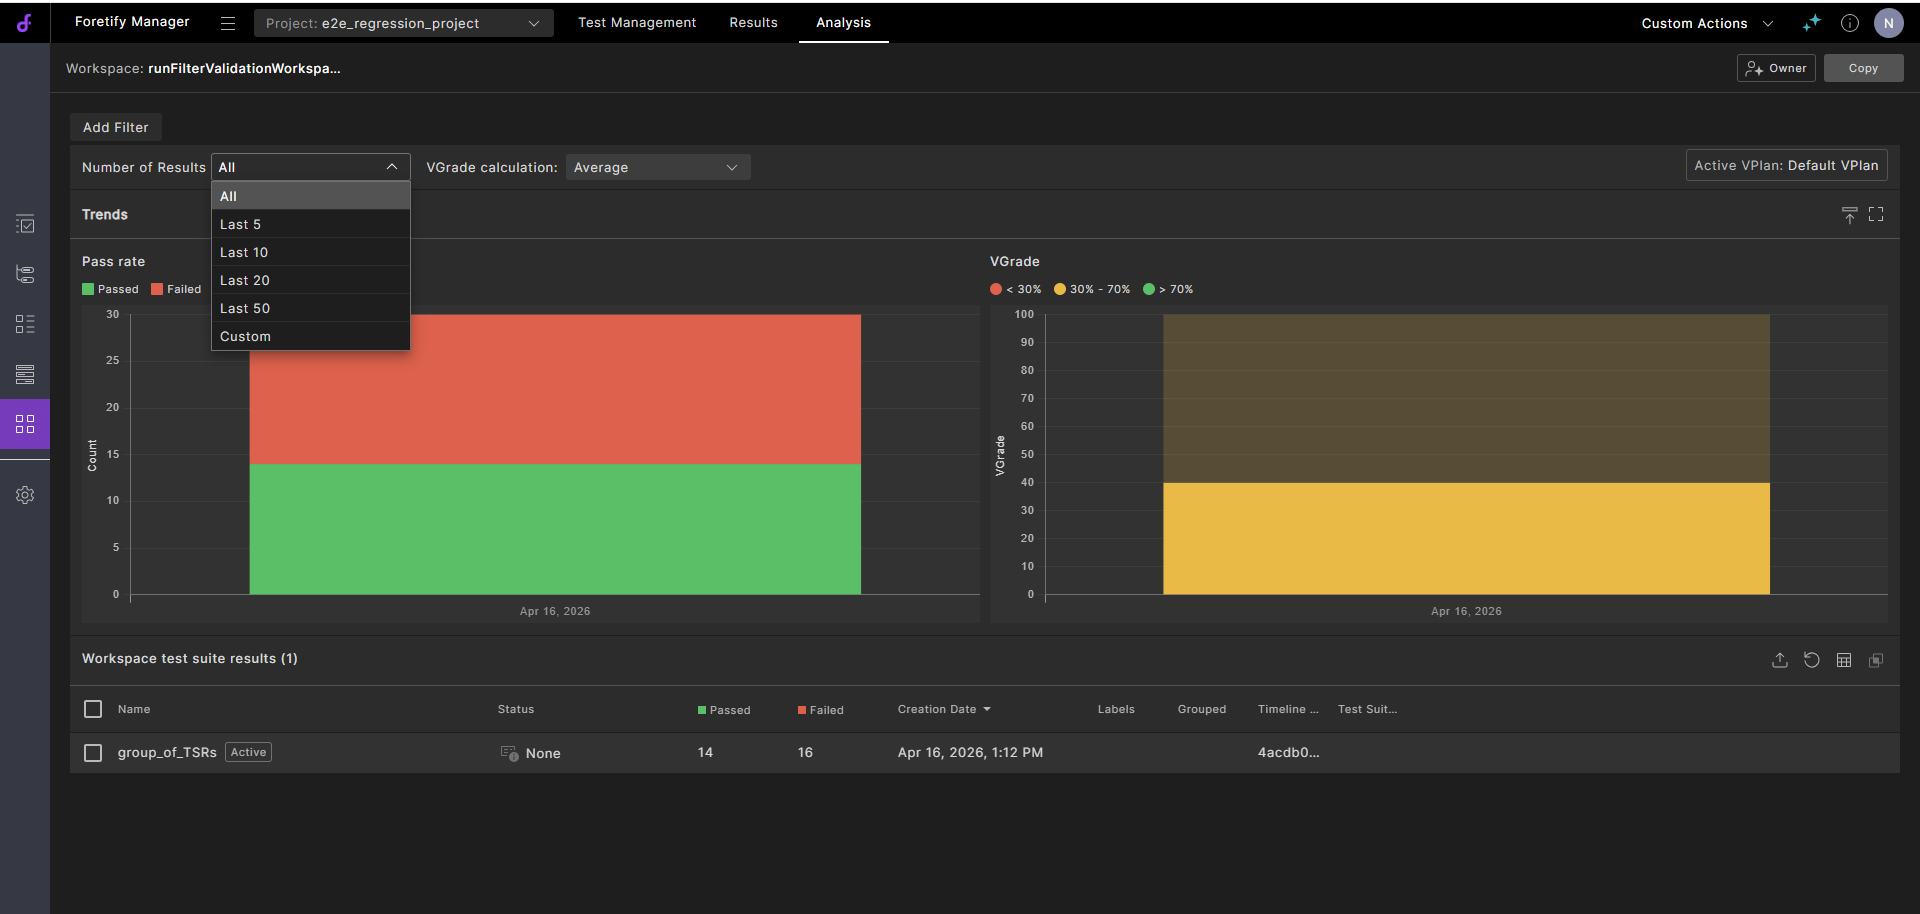
Number of Results: Specifies how many timeline points from the workspace appear in the trend charts.
-
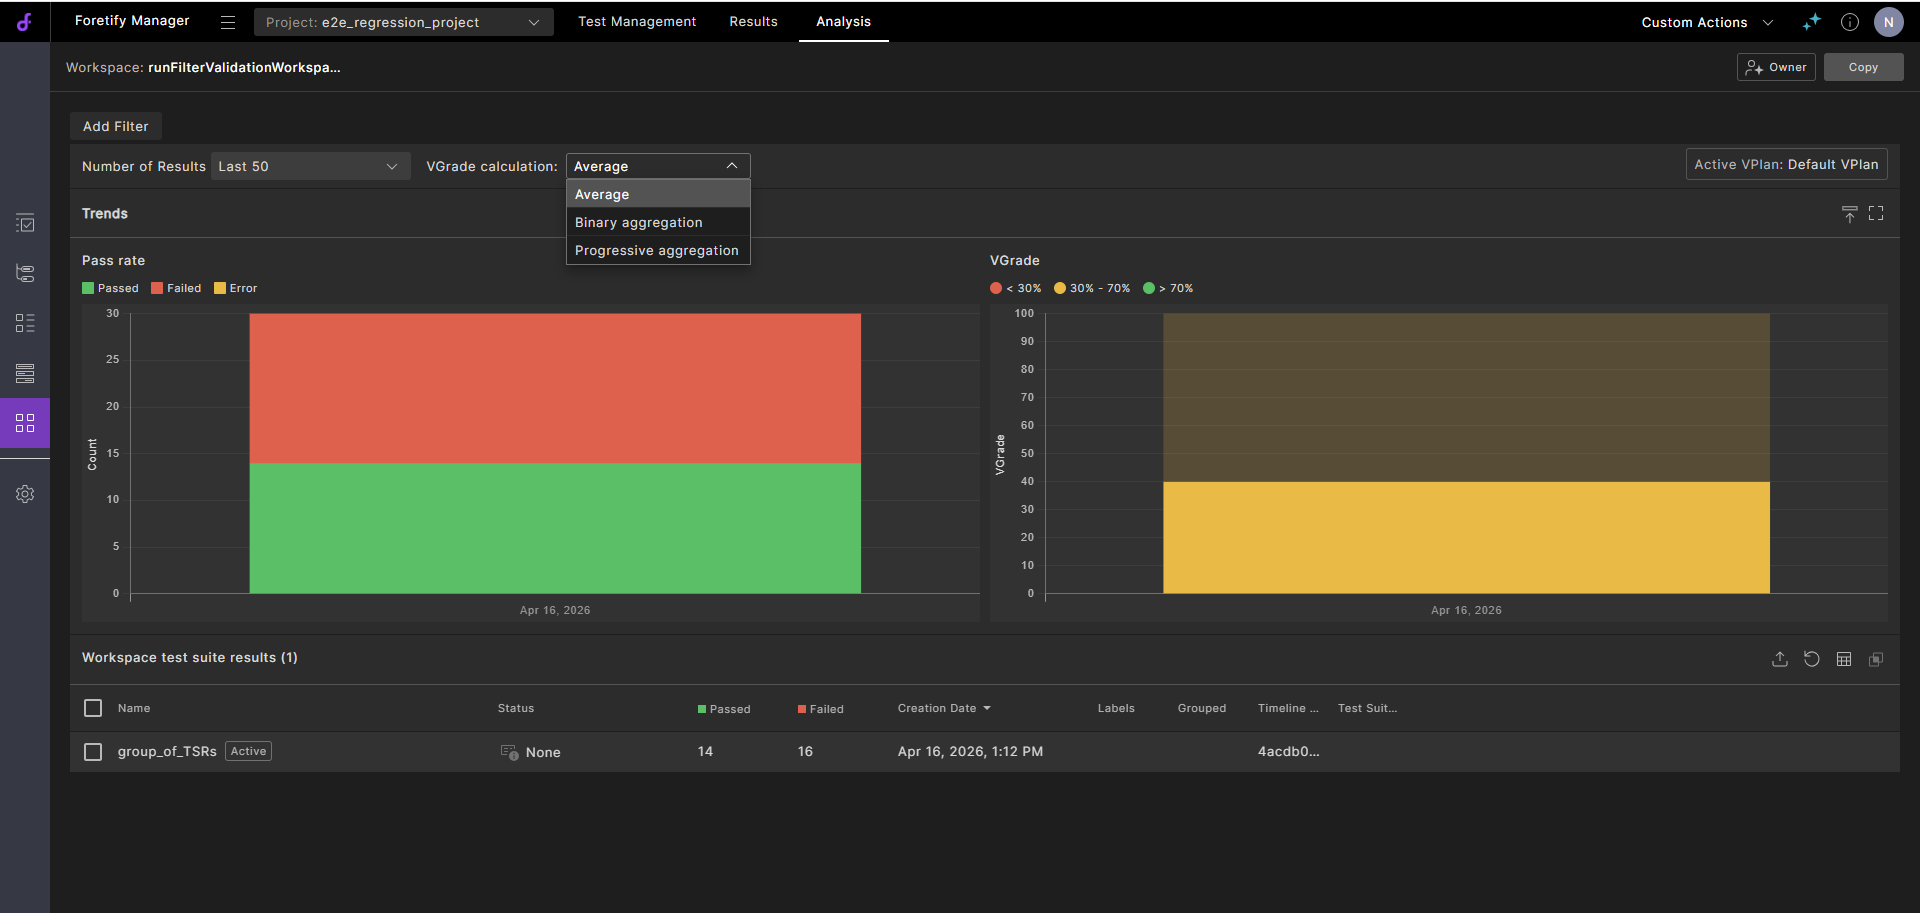
VGrade calculation: Defines how VGrade values are calculated when multiple results are available in the workspace.
-
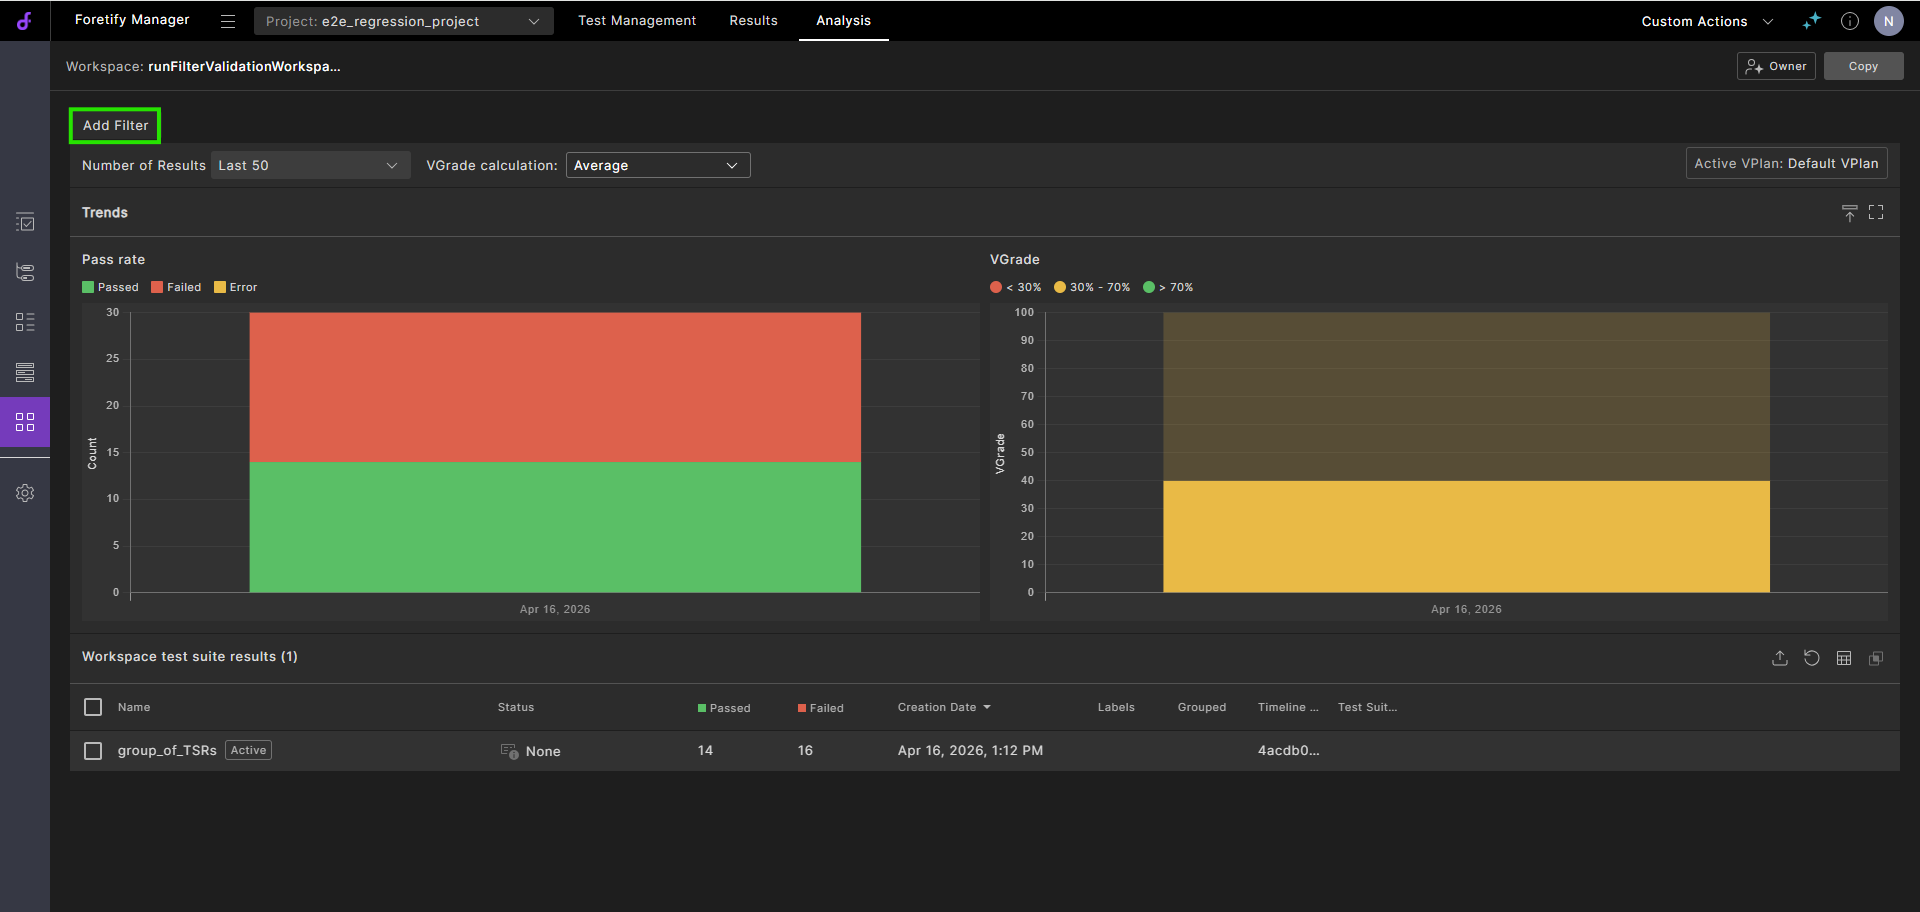
Add Filter: Applies additional filters on the workspace test suite results to narrow the displayed results to a focused subset.
Analyzing Trends
The Trends display two complementary visualizations:
-
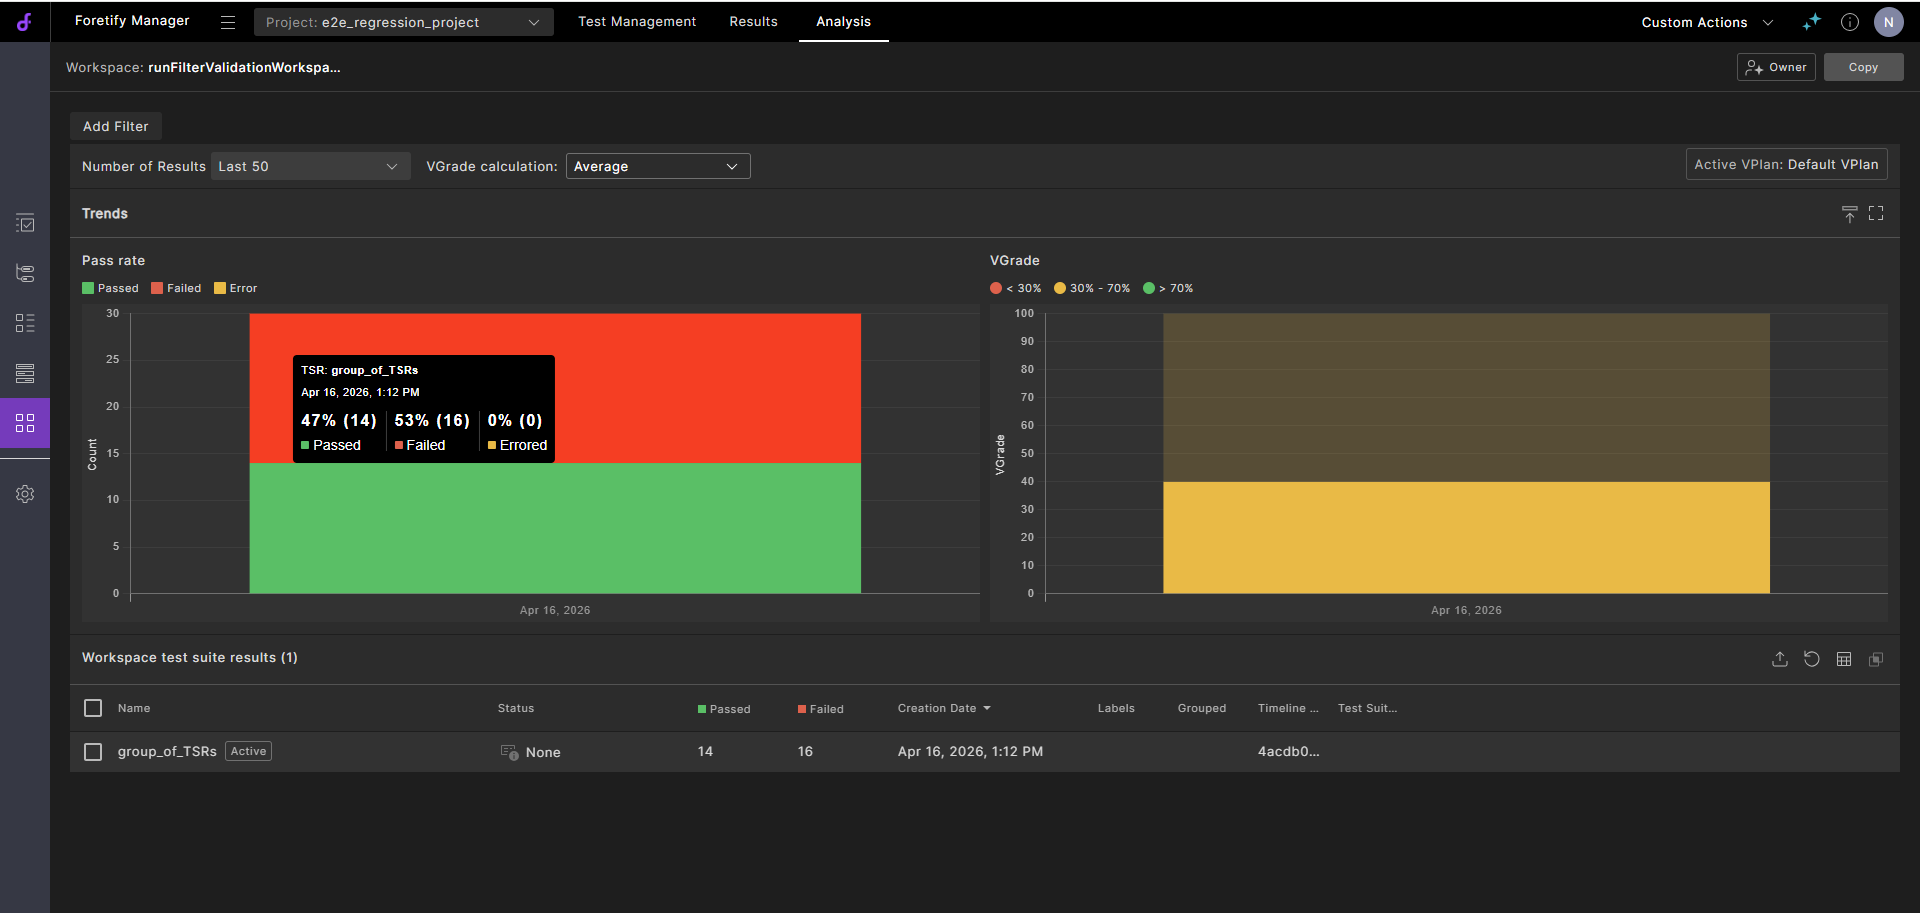
Pass rate chart: Displays test execution outcomes over time as stacked bar charts.
- Green indicates passed tests
- Red indicates failed tests
- Yellow indicates errors
Hover over the graph icons to display a summary of percentages of passed, failed and errored tests.
-
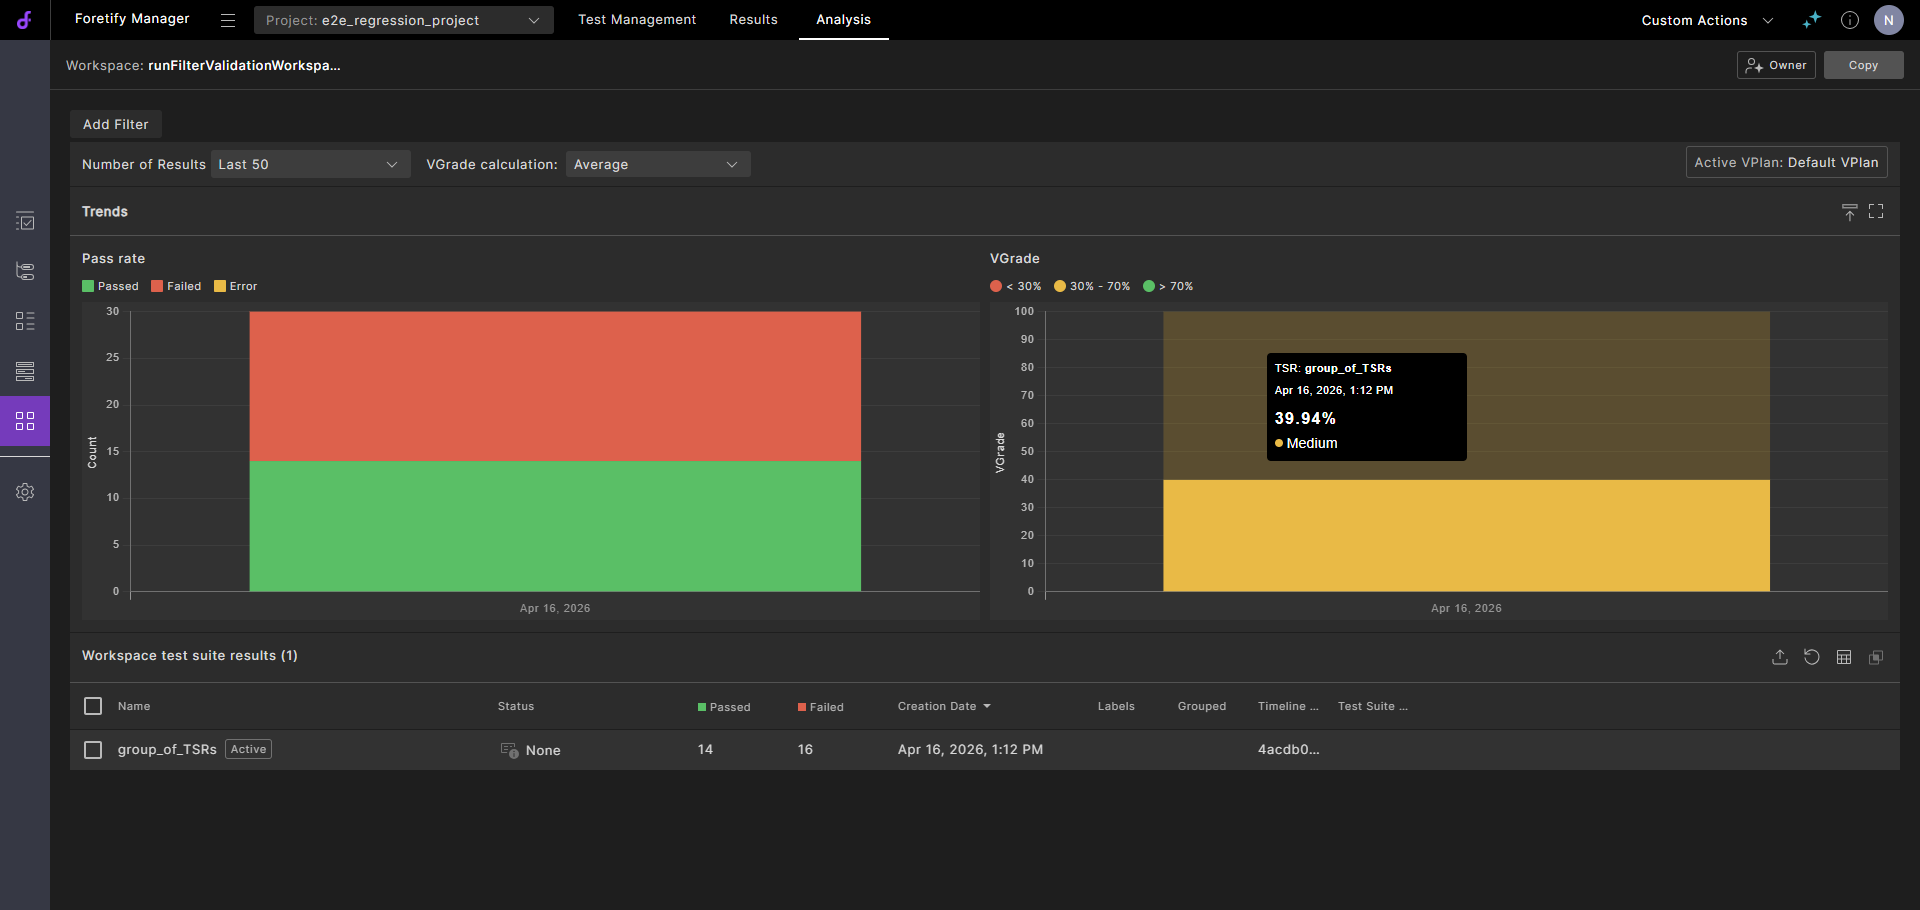
VGrade chart: Displays coverage progress over time.
- Red indicates low coverage
- Yellow indicates medium coverage
- Green indicates high coverage
Hover over the VGrade graph to display a summary of the VGrade percentage.
Test Suite Results
The Workspace Test Suite Results table appears below the trend charts and lists the individual Test Suite Results (TSRs) that populate the Analysis view.
Click the Table selector  icon and customize which attribute columns to display.
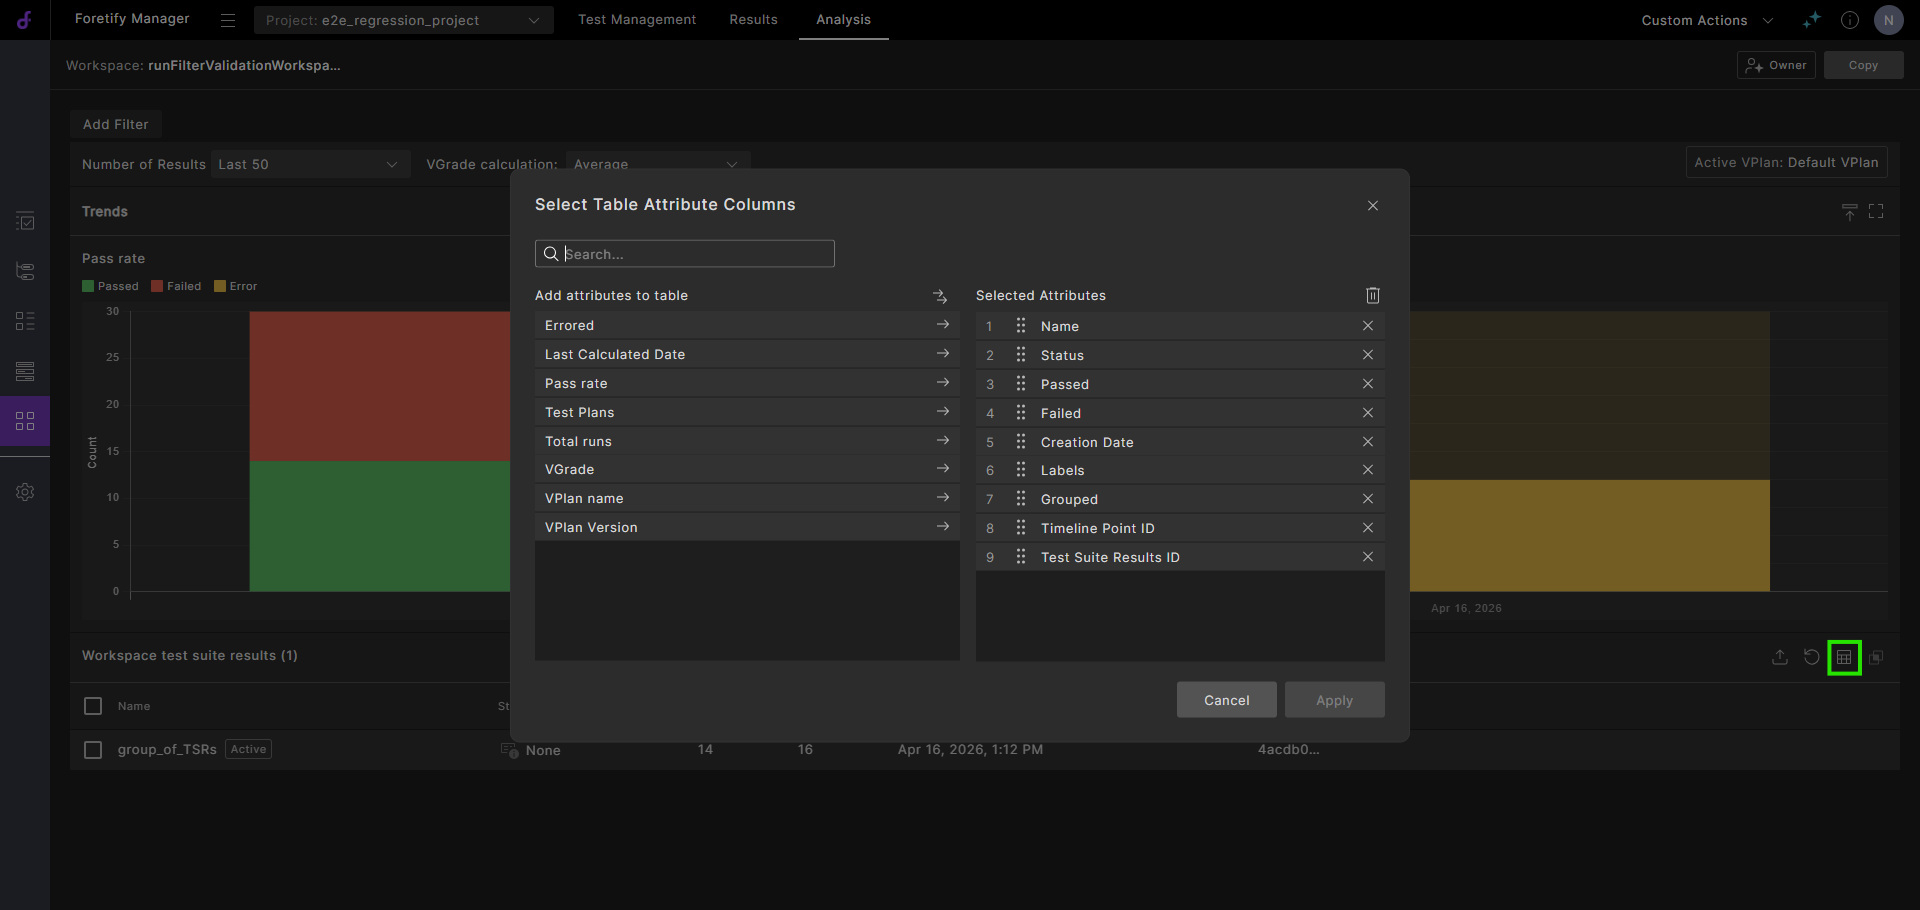
| Attribute | Description |
|---|---|
| Name | Test Suite Result identifier |
| Status | Completion state and percentage |
| Passed | Number of passed tests |
| Failed | Number of failed tests |
| Creation Date | Date when the TSR was created |
| Labels | Applied labels |
| Grouped | Grouping indicator |
| Timeline Point ID | Associated timeline point |
| Test Suite Results ID | Unique identifier |
| Errored | Number of tests with errors |
| Last Calculated Date | Date when metrics were last calculated |
| Pass Rate | Percentage of passed tests, shown with a progress bar |
| Test Plans | Associated test plans |
| Total Runs | Total number of test runs |
| VGrade | Coverage score with a visual indicator |
| VPlan Name | Associated verification plan name |
| VPlan Version | Verification plan version used for calculation |